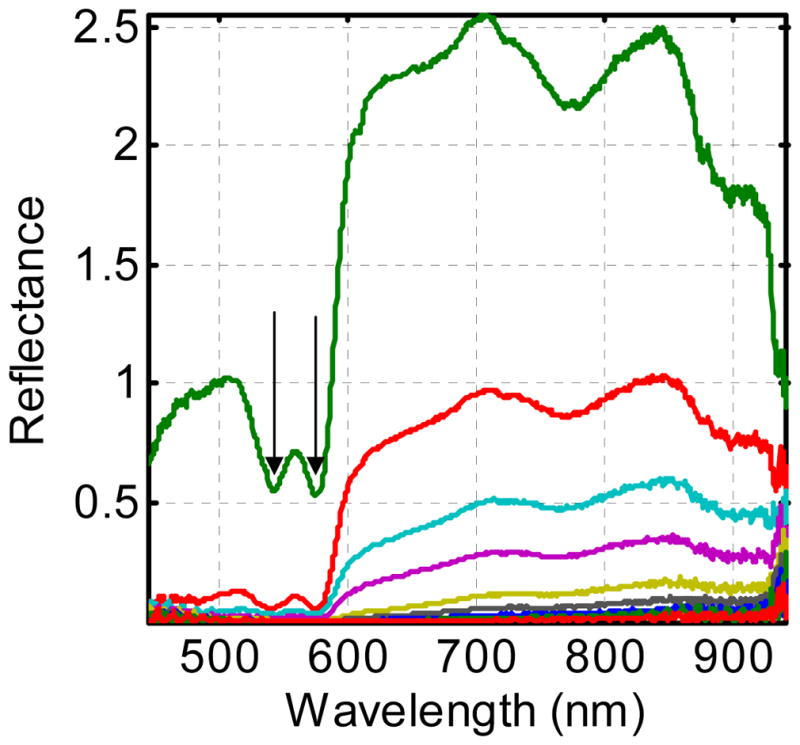
Figure 4.

Diffuse reflectance spectra obtained from the interior chest wall of a typical patient. Each spectrum was acquired at a different source-detector separation, as indicated in the inset of figure 1. The double minima around 570 nm (arrows) in each spectrum result from oxyhemoglobin absorption.
