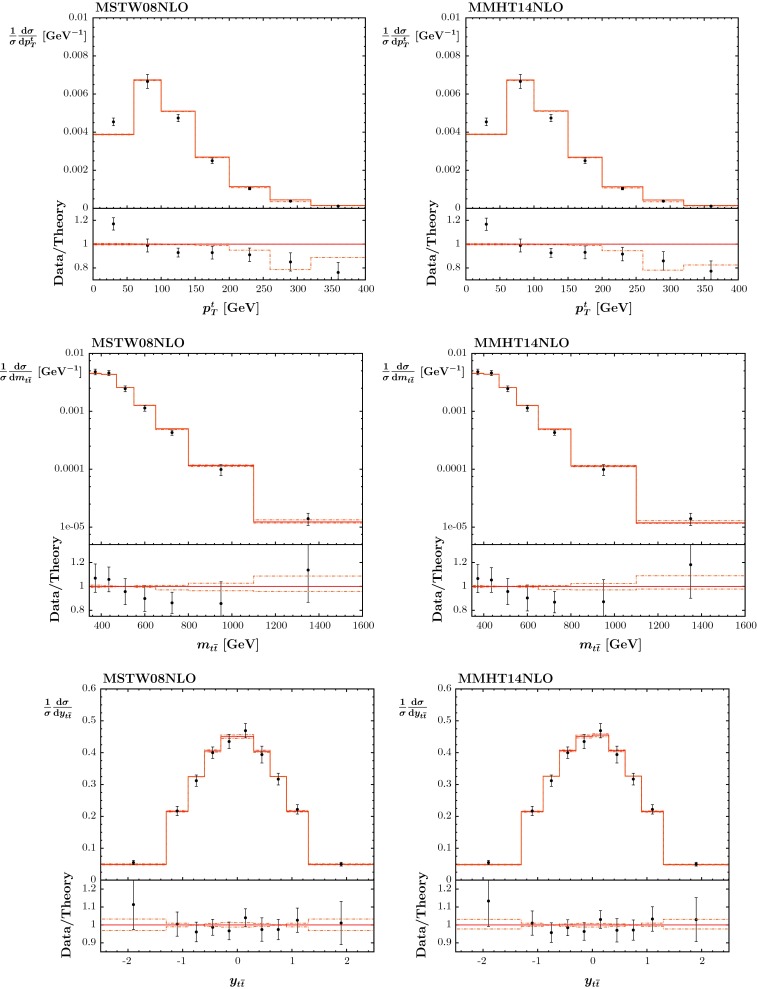
Fig. 29.

The CMS differential top quark data as functions of (top pair of plots), of (middle plots), and of (bottom plots), compared to the predictions of the MSTW2008 PDFs (left) and MMHT2014 PDFs (right). The dotted lines represent the PDF uncertainties
