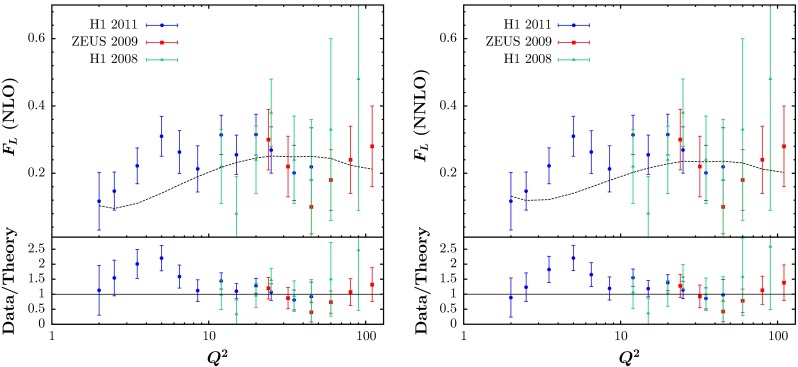
Fig. 5.

The fit quality for the HERA data on from [63–65] at NLO (left) and NNLO (right). The dotted curve, shown for illustration, is obtained from the prediction for the data in [64] below and from the prediction for the data in [65] above this. The “Data/Theory” comparison is obtained for the individual data points in each case
