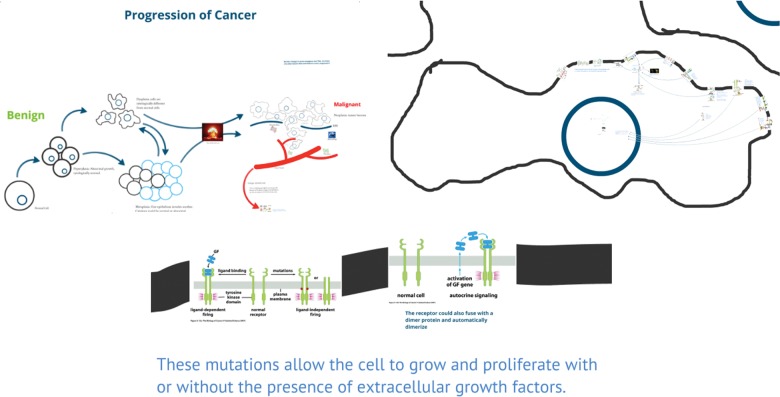
Figure 2.
(A) Screenshot showing an overview of a synthesis map that used primarily spatial organization; you can explore the map and follow the author’s suggested path by following this link: http://prezi.com/tp6jcnrnlh3a/synthesis-map-complete-version/?utm_campaign=share&utm_medium=copy. (B) A closer view of frame 9 of the map, which illustrates finer details of the spatial organization of information. The student has created a representation of a cell and its nucleus. (C) Frame 31 of the same synthesis map shows a representative image of how some students incorporated images of transmembrane receptors at the cell surface into their spatial model of a tumor cell. Sources for images used within the map are provided in the Supplemental Material.

