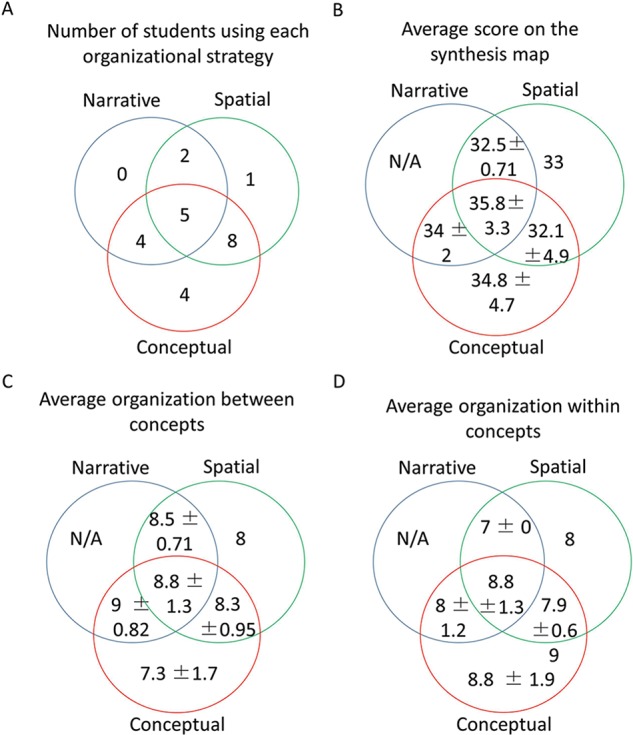
Figure 4.

Venn diagrams describing the distribution of organizational strategies used on students’ synthesis maps and matching organizational strategies to average values for map scores. (A) The number of students utilizing each organizational strategy alone or in combination. (B) The average score on the synthesis map (out of 40) for each organizational scheme (± σ). (C) The average score for organization between major concepts on the synthesis map (out of 10) for each organizational scheme. (D) The average score for organization within individual concepts on the synthesis map (out of 10) for each organizational scheme.
