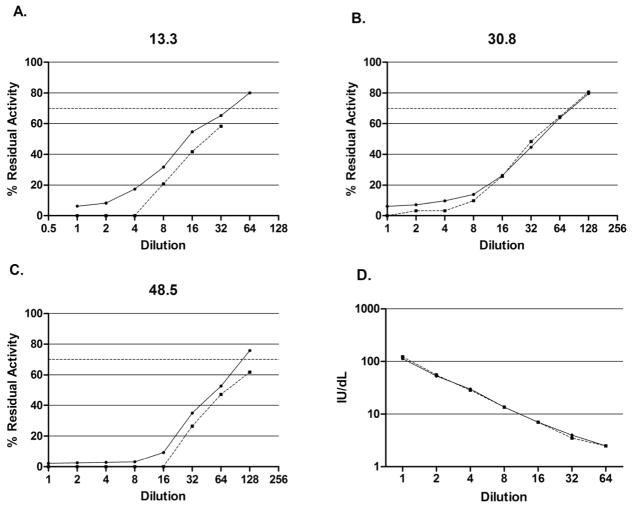
Figure 4.
Dilution curves for inhibitors of 13.3 Nijmegen-Bethesda units (NBU) (A), 30.8 NBU (B), and 48.5 NBU (C). Solid lines represent the Nijmegen-Bethesda Assay. Dashed lines represent the Chromogenic Bethesda Assay with the cutoff for positivity (dotted line) at 70% residual activity (0.5 NBU). D. Dilution curve of factor VIII (FVIII) activity assay. Solid line represents FVIII clotting assay. Dashed line represents FVIII chromogenic assay.

