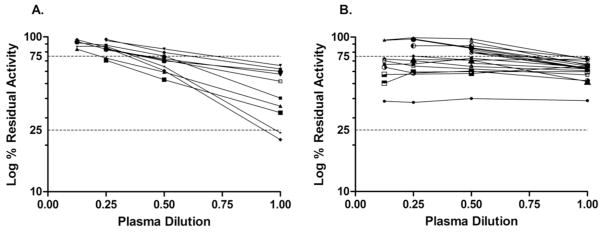
Figure 6.

Nijmegen-Bethesda Assay (NBA) dilution curves of inhibitor plasmas. A: Concordant specimens [positive NBA and positive Chromogenic Bethesda Assay (CBA)].B: Discordant specimens (positive NBA and negative CBA). Dashed lines at 75% and 25% residual factor VIII activity define the interval within which NBU are calculated, representing the 0.4 and 2.0 NBU levels, respectively.
