
Fig 2.
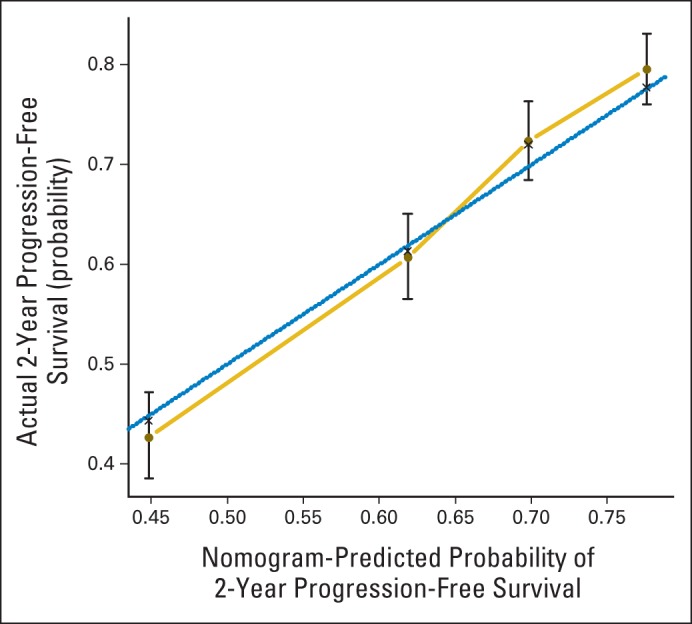
Calibration curve for progression-free survival nomogram model. Dashed line represents ideal nomogram, and solid line represents observed nomogram. Vertical bars indicate 95% CIs, and crosses indicate bias-corrected estimates.
Official websites use .gov
A
.gov website belongs to an official
government organization in the United States.
Secure .gov websites use HTTPS
A lock (
) or https:// means you've safely
connected to the .gov website. Share sensitive
information only on official, secure websites.
Calibration curve for progression-free survival nomogram model. Dashed line represents ideal nomogram, and solid line represents observed nomogram. Vertical bars indicate 95% CIs, and crosses indicate bias-corrected estimates.