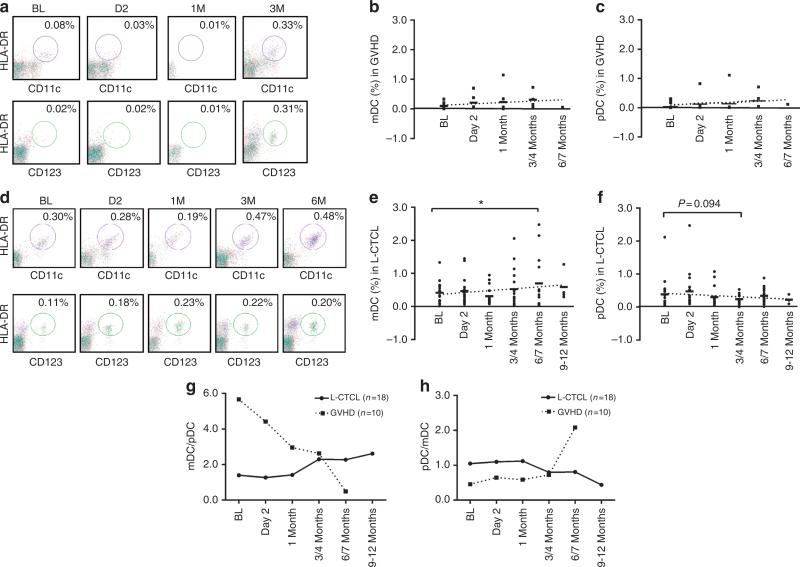
Figure 2. Effect of extracorporeal photopheresis (ECP) on Lin−HLA-DR+CD11c+ myeloid dentritic cells (mDCs) and Lin−HLA-DR+CD123+ plasmacytoidDCs (pDCs) in graft-versus-host disease (GVHD) and leukemic cutaneous T-cell lymphoma (L-CTCL) patients.
(a) The representative flow plots from GVHD patient no. 3 for Lin−HLA-DR+CD11c+ mDCs (upper panel, circled portions) and Lin−HLA-DR+CD123+ pDCs (lower panel, circled portions) are presented. The % of (b) mDCs and (c) pDCs in GVHD patients at baseline (BL), day 2, 1 month, 3/4 months, and 6/7 months after ECP. (d) The representative flow plots from L-CTCL patient no. 11 are presented. The % of (e) mDCs and (f) pDCs in L-CTCL patients at BL, day 2, 1 month, 3/4 months, 6/7 months, and 9–12 months after ECP. The dotted lines are linear trend lines. Linear mixed model analysis, *P<0.05. The average (g) mDC/pDC and (h) pDC/mDC ratios in L-CTCL (-●-) versus GVHD (...■...) at BL day 2, 1 month, 3/4 months, 6/7 months, and 9–12 months after ECP.

