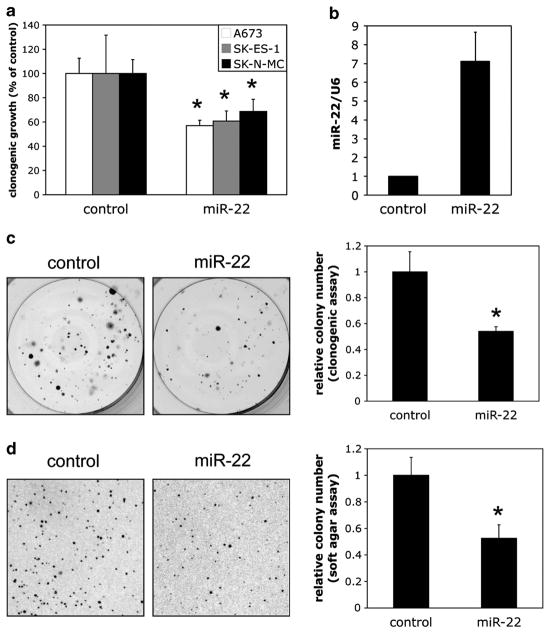
Figure 1.
MiR-22 is inhibitory to clonogenic and anchorage-independent growth in Ewing Sarcoma. (a) The indicated Ewing Sarcoma cell lines (all described previously,6 and authenticated by short tandem repeat (STR) profiling) were transfected with 25 nM miR-22 mimic or non-targeting negative control mimic, as previously described,6 harvested the following day and plated at 500 cells per well in six-well plates. Colonies were stained 14 days later with 0.1% crystal violet in 25% MeOH, and quantified using NIS-elements imaging software. Results represent the mean and standard deviation of triplicate platings, with the control set to 100%. (b) For stable overexpression of miR-22, the miR-22 genomic locus, including approximately 250 bp of upstream and downstream flanking sequence, was PCR amplified from Ewing Sarcoma A673 cells, and cloned into the pMSCV-Puro retroviral expression vector, using standard molecular techniques and verification by sequencing. Replication-incompetent, vesicular stomatitis virus glycoprotein (VSV-G) pseudotyped, infectious retrovirus was prepared essentially as previously described,6 using a retroviral packaging system. Transduction of Ewing Sarcoma cells with viral supernatant was performed as previously described.6 Control cells were infected with empty pMSCV-Puro. Following selection with Puromycin (2 μg/ml), quantification of mature miR-22 levels was performed on whole Trizol-extracted RNA using the Qiagen miScript SYBRgreen quantitative reverse transcription-PCR system, with U6 as the internal control, as previously described.6 MicroRNA primers were obtained from Qiagen. MiR-22 level in control cells is set to 1. (c) Clonogenic assays on control and miR-22 stably overexpressing cells were performed as in a, in the presence of Puromycin (2 μg/ml). Quantifications represent the mean and standard error of the mean (s.e.m.) of two independent experiments, each performed in at least triplicate; representative images from one experiment are also shown. (d) Soft agar assays were performed as described,6 using 1 ×10⁴ cells. Quantifications represent the mean and s.e.m. of two independent experiments, each performed in at least triplicate; representative images from one experiment are also shown. *P<0.05 relative to control, using a two-way Student’s t-test with unequal variance.

