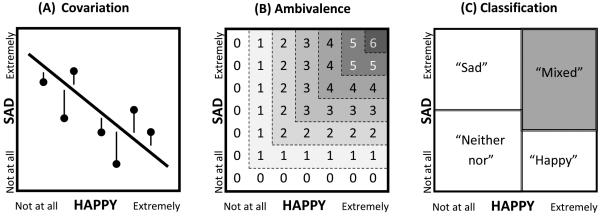
Figure 1.

Schematic illustration of three operational definitions of mixed emotional experiences. (A) Covariation approach: points that deviate from the perfect negative regression line are indicative of mixed emotions. (B) Ambivalence approach: darker shaded cells with higher numbers represent more intense mixed emotions. (C) Classification approach: mixed emotions represent a distinct category based on the bivariate pattern of happiness and sadness (areas for emotion categories are empirically determined and may differ in size and shape).
