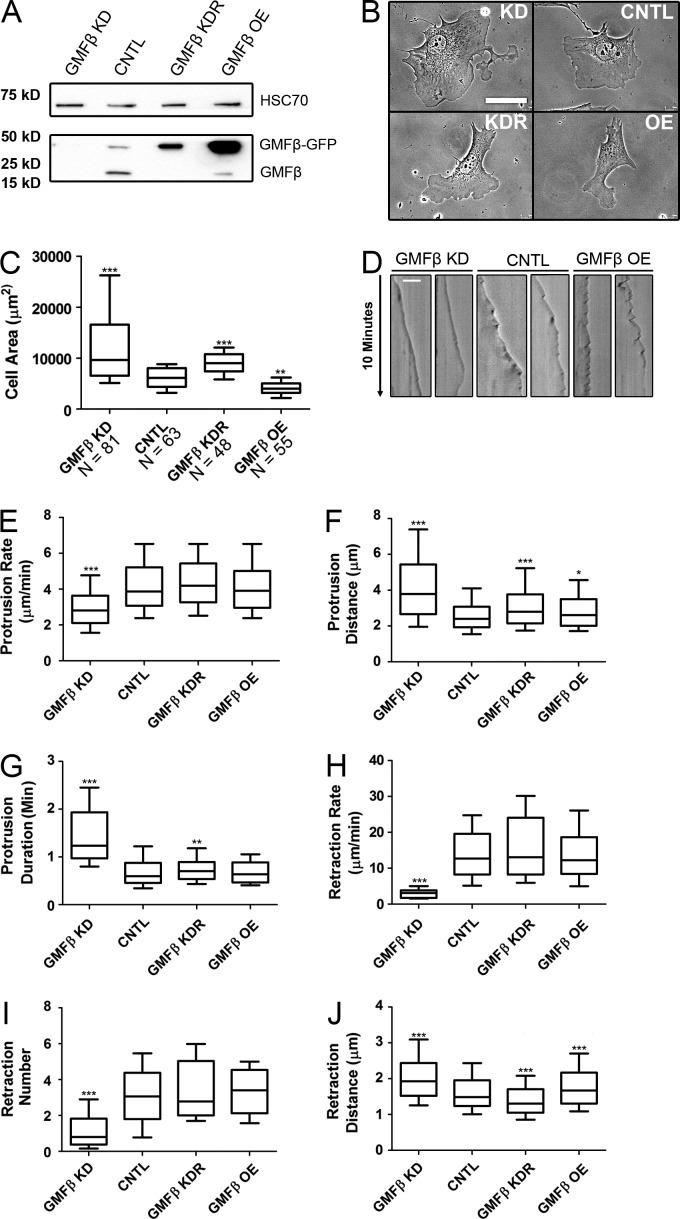
Figure 2.
Changes in GMFβ expression level alter cell shape and lamellipodial dynamics. (A) Western blot showing GMFβ expression of created cell lines. (B) GMFβ-depleted (KD) and -overexpressing (OE) cells show phenotypic changes versus control (CNTL) and knockdown-rescue (KDR) cell lines. Bar, 50 µm. (C) Cell area quantified from micrographs. (D) Example kymographs for GMFβ KD, CNTL, and GMFβ OE. Bar, 10 µm. (E) Protrusion rate in micrometers per minute measured from kymography. (F) Protrusion distance in micrometers. (G) Protrusion duration in minutes. (H) Retraction rate in micrometers per minute. (I) Mean number of retractions per protrusion. (J) Retraction length in micrometers. For all graphs, error bars represent 10th–90th percentile. Kruskal-Wallis multiple comparison testing was performed, and significance was measured with a Dunn’s post-test. ***, P < 0.001; **, P < 0.01; *, P < 0.05. n ≥ 20.

