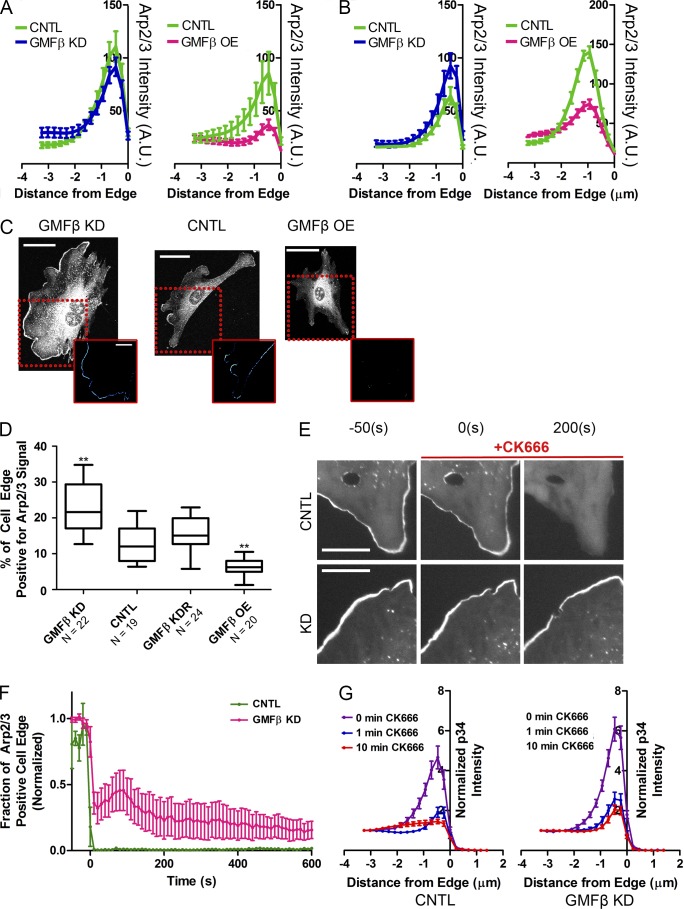
Figure 3.
GMFβ alters distribution and stability of Arp2/3 branched actin in the lamellipodium. (A) Mapping of p34 (Arp2/3) intensity in synchronized lamellipodia of GMFβ KD (left) or GMFβ OE (right) versus CNTL. The cell edge is at 0. Error bars indicate SEM. (B) Mapping of p34 (Arp2/3) intensity in unsynchronized lamellipodia of GMFβ KD (left) or GMFβ OE (right) versus CNTL. The cell edge is at 0. Error bars indicate SEM. (C) Arp2/3 IF in GMFβ KD, CNTL, and GMFβ OE cells with synchronized lamellipodia. Insets represent a computer-generated map of high Arp2/3 edge signal for each image. Bars: (top) 50 µm; (bottom) 25 µm. (D) The percentage of cell edge positive for high Arp2/3 signal, generated from p34 IF. Error bars represent the 10th–90th percentile. A Kruskal-Wallis multiple comparison testing was performed, and significance was measured with a Dunn’s post-test (***, P < 0.001; **, P < 0.01; *, P < 0.05). (E) Stills from a live-cell wash-in of CK666 on p34 knockdown cells rescued with p34-GFP (p34KDR). Control p34KDR cells (top) were compared with p34KDR cells depleted of GMFβ (bottom). CK-666 was added at 0 s. Bars, 25 µm. (F) Representative movies from E were analyzed to determine the percentage of the cell edge occupied by high Arp2/3 signal. CNTL n = 3, GMFβ KD n = 5. Error bars indicate SEM. (G) p34KDR WT and p34KDR cells depleted of GMFβ were treated with CK-666 for the listed times and fixed, then edge intensity of p34-GFP was measured for each time point. Error bars indicate SEM. 0 min n = 16 for both CNTL and KD, all other times n = 14 cells for both CNTL and KD.

