Figure 1.
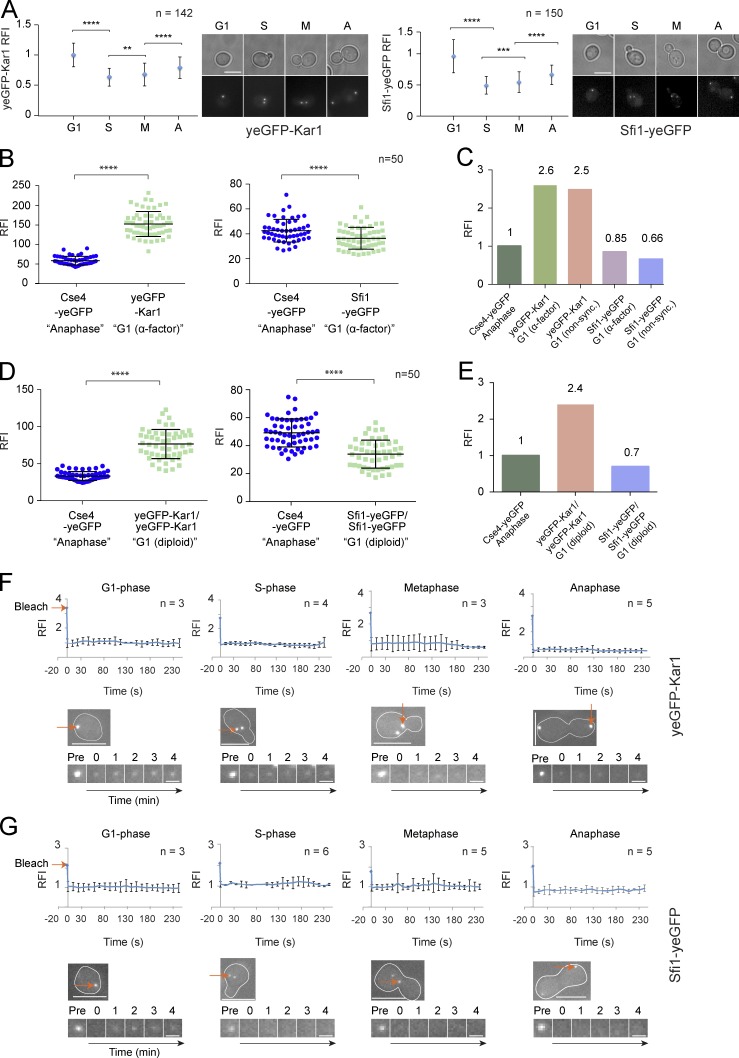
Kar1 and Sfi1 show coordinated behavior and are stably integrated into the half bridge and bridge during the cell cycle. (A) Kar1 and Sfi1 levels at the SPB. The RFI of yeGFP-Kar1 and Sfi1-yeGFP at SPBs was measured during G1 phase, S phase (S), metaphase (M), and anaphase (A). (B) RFI of yeGFP-Kar1 and Sfi1-yeGFP in α-factor–arrested cells. Anaphase CSE4-yeGFP cells were used as a fluorescence standard. (C) Quantification of yeGFP-Kar1 and Sfi1-yeGFP in α-factor–synchronized and unsynchronized cells. (D) Quantification of yeGFP-Kar1 and Sfi1-yeGFP in G1 unsynchronized diploid cells. (E) Quantification of D. (F and G) FRAP of SPB-associated yeGFP-Kar1 and Sfi1-yeGFP in G1, S, M, and A cells. Red arrows indicate the position of bleaching. n, number of analyzed SPBs. ****, P ≤ 0.0001; ***, P ≤ 0.001; **, P ≤ 0.01; ns, P > 0.05. Error bars indicate SD. Bars: (A, F, and G, top images) 5 µm; (F and G, bottom images) 1 µm.

