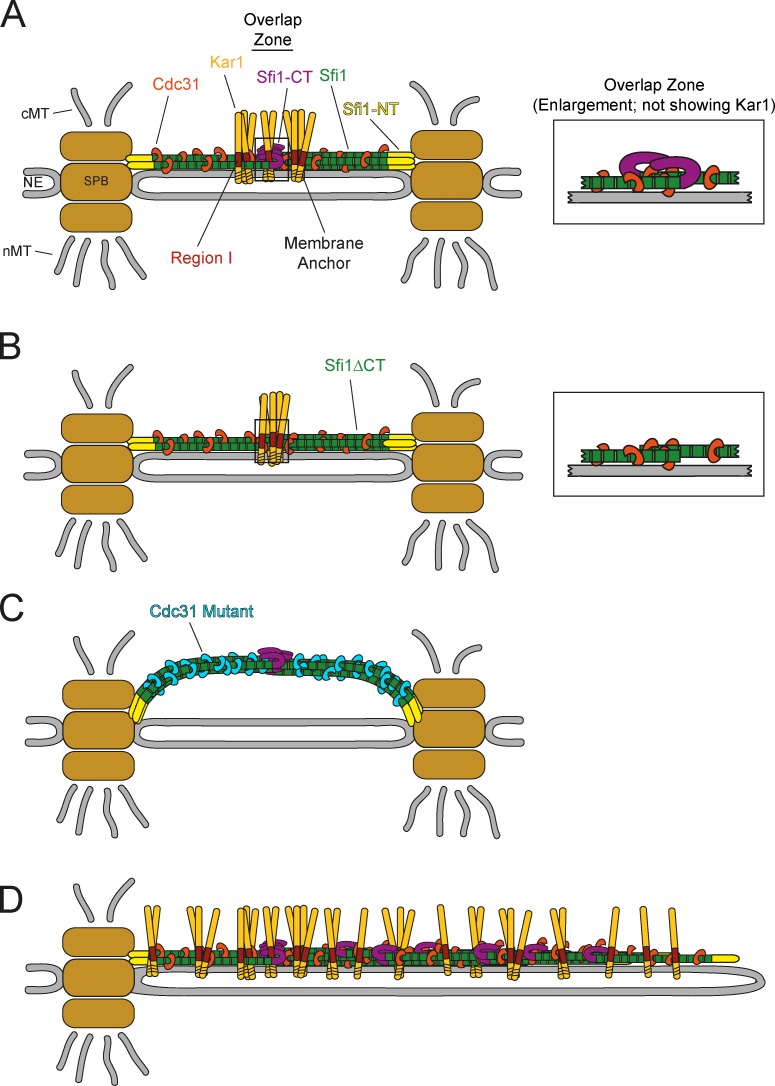
Figure 10.
Model for the SPB bridge. (A) Model of paired SPBs showing the bridge components in a wild-type situation. (B) The bridge of sfi1Δct cells. Note that Kar1 was omitted from the enlargements. (C) The arched bridge phenotype observed in kar1Δ CDC31-16 cells. (D) Model for the extraordinary elongated bridge structure of Gal1-KAR1 cells.

