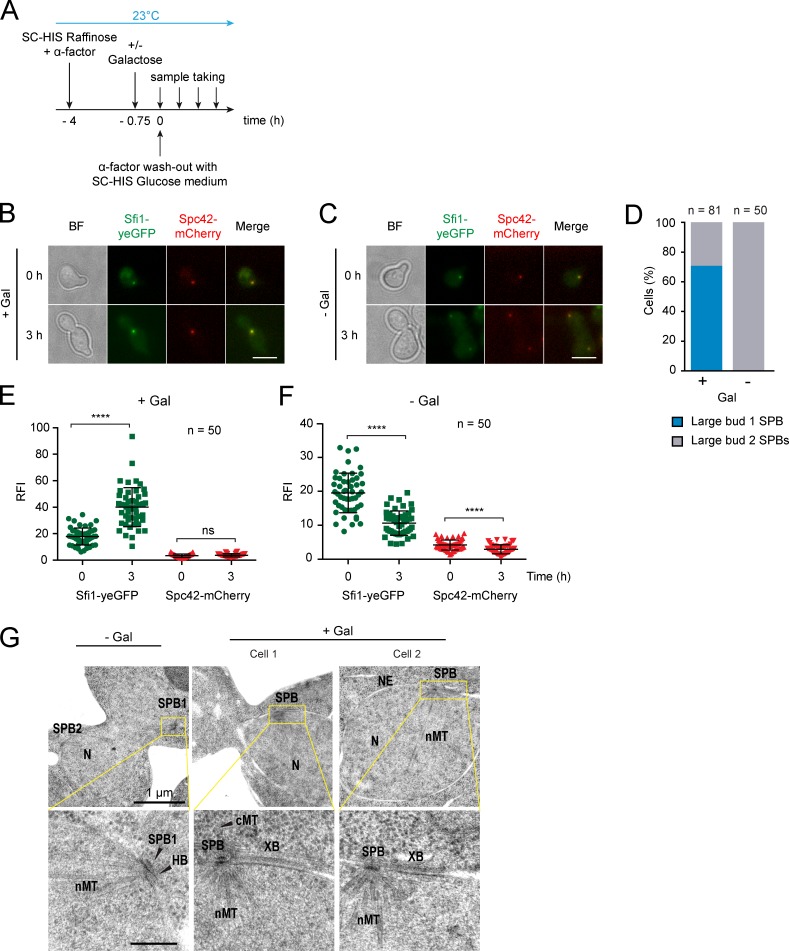
Figure 9.
Elevated Kar1 dosage leads to an extraordinarily elongated bridge. (A) Timeline of performed experiments. (B and C) The effect of KAR1 overexpression on SPB separation. Sfi1-yeGFP and Spc42-mCherry signals were monitored. (D) Quantification of SPB number of large-budded cells from B and C at 3 h. (E and F) Quantification of the Sfi1-yeGFP and Spc42-mCherry signals at the SPB of cells from B and C. Note: at 0 h, the SPB signal consists of the mother SPB and the satellite. In cases where two SPB signals were visible at 3 h (F), each SPB was quantified separately. ****, P ≤ 0.0001; ns, P > 0.05. Error bars indicate SD. (G) EM images of cells from B and C. NE, nuclear envelope; cMT, cytoplasmic microtubules; nMT, nuclear microtubules; N, nucleus; XB, extraordinary elongated bridge. The boxed regions are enlarged in the panels below. n, number of cells analyzed. Bars: (B and C) 5 µm; (G) 200 nm unless otherwise indicated.

