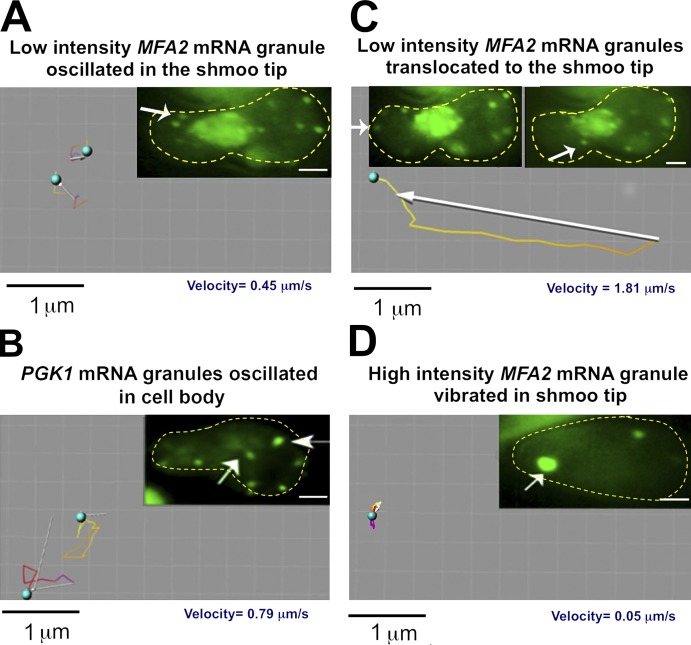
Figure 3.
Tracking analysis of MFA2 and PGK1 mRNA granules. (A–D) Cells expressing a MFA2-U1A detection system (A, C, and D) or a PGK1-U1A detection depiction system (B) were treated with αF for 2 h and high- and low-intensity granules (marked by arrows) in the shmoo region and cell body were tracked using the Imaris program in 2D videos (see Materials and methods). Images in A and C are snapshots taken from Videos 2 and 3. The yellow dotted lines highlight the cell boundary. (A) Two low-intensity MFA2 mRNA granules located in the shmoo region of the cell were tracked. Note the oscillatory motion and slow translocation of the granules. Tracking shows movement duration of 6.6 s. (B) Two low intensity motile PGK1 mRNAs granules in the cell body were tracked; note the oscillatory motion and slow translocation of the granules. Tracking shows movement duration 6.3 s (Videos 4 and 5). (C) A low-intensity MFA2 mRNA granule that was translocated from the cell body to the shmoo tip was tracked. The right arrow points at the translocated granule, at its half-way location; the left arrow points at this granule at its final destination. The tracking shows movement duration of 4.1 s. Note the rapid translocation from the cell body to the shmoo tip. (D) A high-intensity MFA2 mRNA granule located in the growing shmoo tip was tracked. The tracking shows movement duration of 60 s. Note the vibrational motion of the granule that remains localized to the shmoo tip.

