Figure 8.
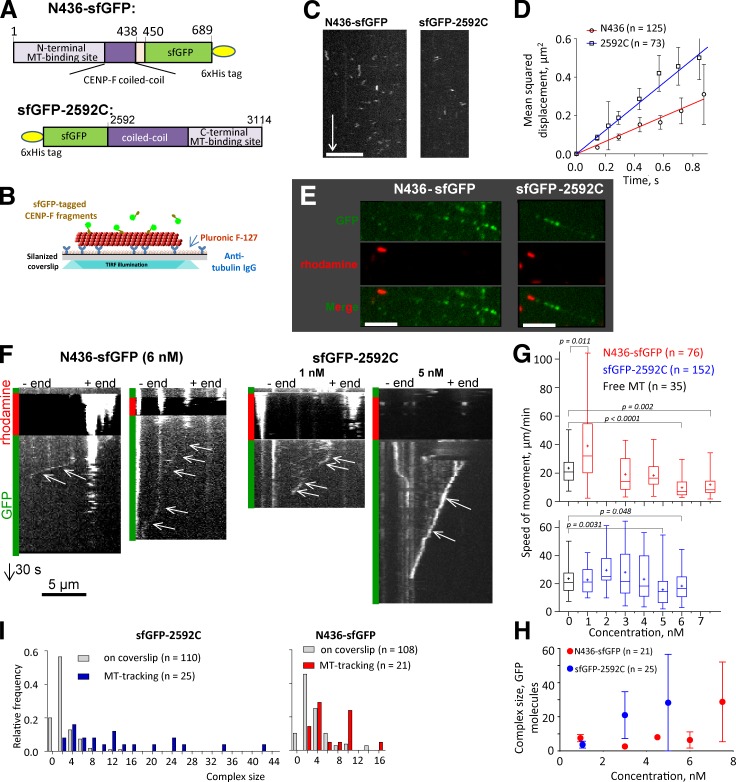
CENP-F fragments can diffuse on a MT’s surface and follow the end of a shortening MT. (A) Domain organization of sfGFP-tagged CENP-F fragments. (B) Experimental setup used to investigate 1D diffusion along stabilized MTs. (C) Kymographs showing diffusing spots of N436-sfGFP (left) and sfGFP-2592C (right). Bars: (horizontal) 5 µm; (vertical) 5 s. (D) Mean squared displacement of N436-sfGFP (circles) and sfGFP-2592C (squares) fitted with linear regressions to calculate diffusion coefficients. (E) Segmented MTs in the presence of N436-sfGFP (left) or 2592C- sfGFP (right), imaged in TIRF regimen. Bars, 5 µm. (F) Kymographs showing movement of CENP-F fragments with the ends of depolymerizing MTs. Vertical bars at the left of the kymograph color code the fluorescent channels used for imaging. Arrows point to the MT-tracking events: oblique lines that correspond to the spot movement from the MT plus end (right) toward the minus end (left). Bars: (horizontal) 5 µm; (vertical) 30 s. (G) Speed of MT disassembly in the absence of CENP-F (black) or the speed of movement of the distal fluorescent spot with increase of N436-sfGFP (red) or sfGFP-2592C (blue) concentration in the chamber. P-values are reported for an unpaired t test. The difference is not significant where the p-values are not reported. The bars show box (25–75%) and whisker (minimum to maximum) plots; horizontal line shows median; + is the mean. (H) The size of the MT-tracking complex as a function of N436- sfGFP or sfGFP-2592C concentration in the chamber. (I) Frequency distribution of the intensity of MT-tracking and coverslip-associated spots of N436-sfGFP or sfGFP-2592C expressed as the number of GFP molecules in a spot.

