Figure 9.
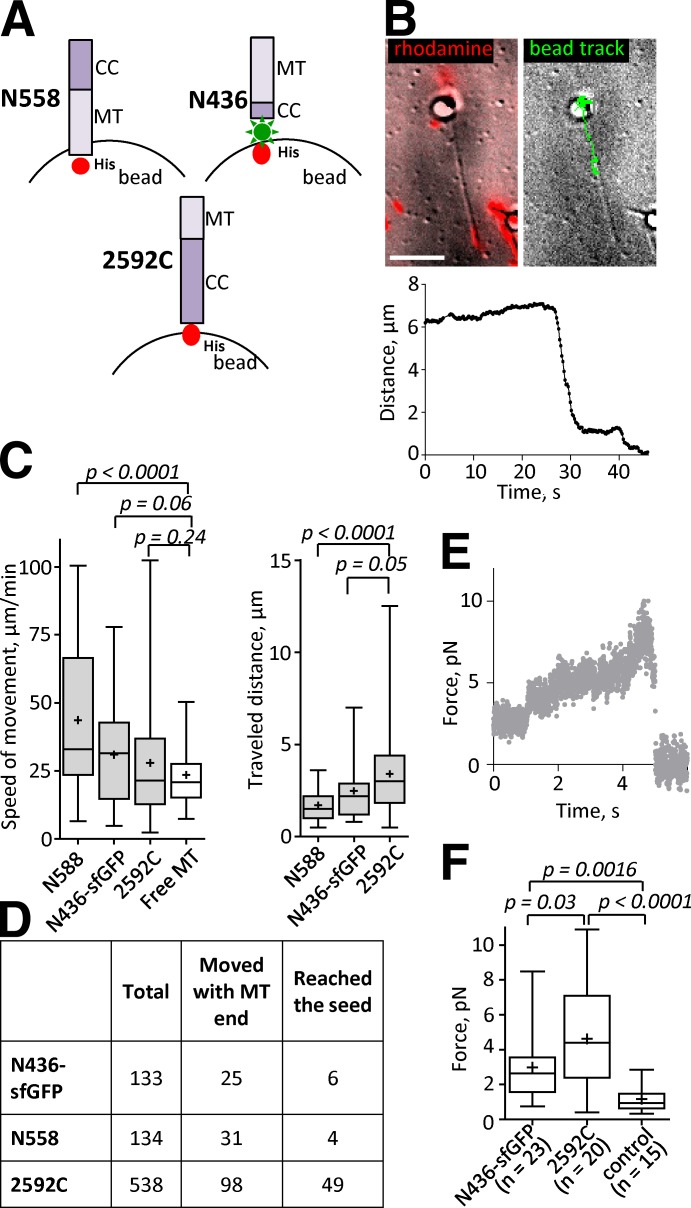
CENP-F fragments transport cargos and transduce significant forces from tubulin depolymerization. (A) Schematics of attaching CENP-F fragments to the surface of beads (not to scale). Note that N558 is attached with the MT-binding domain (MT) facing the bead, whereas N436-sfGFP is attached with coiled coil (CC) facing the bead. (B) A bead coated with N436-sfGFP is attached to a segmented MT. Left image shows an overlay of an average of 18 differential interference contrast images before MT depolymerization was triggered (grayscale) and the rhodamine fluorescence (red). Right image shows an overlay of the first frame of the image sequence and the track of the bead’s motion after the depolymerization was triggered. See also Video 3. (bottom) Graph shows a single representative dependence of the distance from the N436-sfGFP–coated bead to the MT seed as a function of time (total n = 98). Bar, 5 µm. (C) Mean speeds (left) and distances (right) traveled by the CENP-F–coated beads. (D) Statistics of the MT-associated beads. Total: number of the beads analyzed; Moved with MT end: number of beads that started processive motion; Reached the seed: number of the beads that processively followed MT ends until they reached the coverslip-bound MT seeds. (E) A representative example of the MT-generated force transduced to the bead by 2592C (total n = 20). (F) Mean forces measured with N436-sfGFP, 2592C, and control beads coated with anti-DIG IgG and attached to DIG-labeled disassembling MTs. The bars show box (25–75%) and whisker (minimum to maximum) plots; horizontal line shows median; + is the mean.

