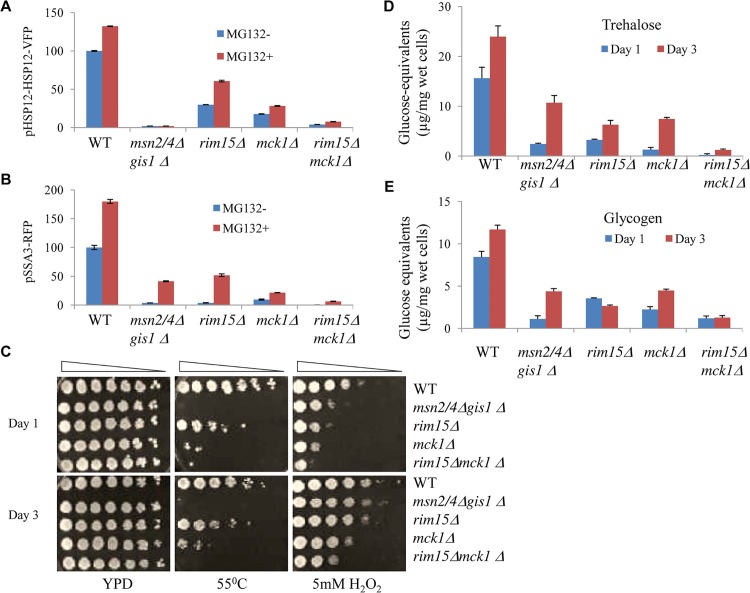
Fig 2. Starvation-induced gene expression, stress resistance, and storage carbohydrates detected in transition-phase cells.
Relative levels of pHSP12-HSP12-VFP (A) and pSSA3-RFP (B) in WT, msn2/4Δgis1Δ, rim15Δ, mck1Δ and rim15Δmck1Δ cells treated with drug vehicle (blue, MG132-) or 12.5μM of MG132 (red, MG132+). C: Heat and oxidative stress resistance in transition-phase cells grown in YPD for 1 day (top) or 3 days (bottom). D and E: The amount of trehalose (D) and glycogen (E) accumulated in WT and mutant cells grown in YPD for 1 day (blue) or 3 days (red).

