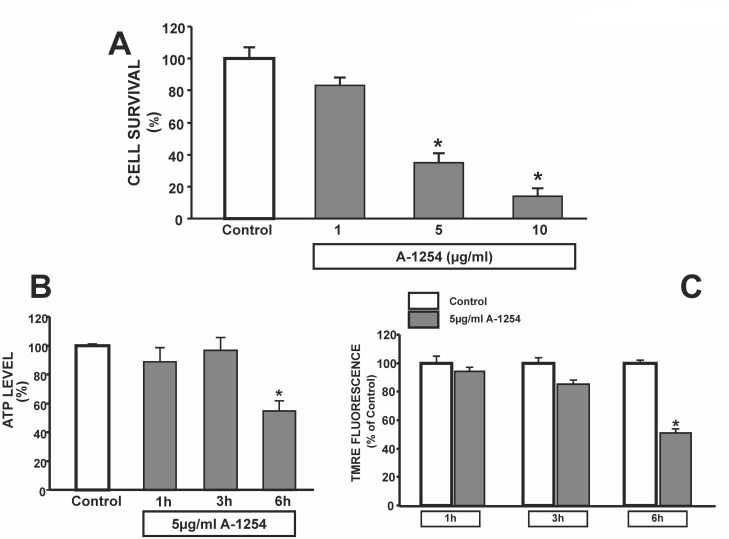
Fig 1. Effect of A1254 on mitochondrial oxidative activity, on ATP production and mitochondrial membrane potential after 24hr exposure in SH-SY5Y cells.
Panel A. Cell Viability in SH-SY5Y cells exposed (24 hrs) to increasing concentrations of A1254 (A1254; 1–5–10 μg/ml). Each bar represents the mean ± SEM (10 different experiments) of cell viability assessed by MTT assay. *P < 0.05 vs control group Panel B. Effect of 5 μg/ml A1254 on ATP content in SH-SY5Y cells. The bar graph represents the ATP content measured after 1, 3 and 6 hrs exposure to PCB. ATP levels were normalized to protein content of each sample. Each bar represents the mean (±S.E.M.) obtained from 6 different sessions in three independent experimental sessions. *P < 0.05 vs control group. Panel C. TMRE analysis of SH-SY5Y cells exposed to A-1254 (5 μg/ml) for 1, 3 and 6 hrs. Cumulative data are expressed as mean ± S.E.M. of TMRE fluorescence changes (percentage of control values taken as 100%). The intensity of fluorescence was calculated as arbitrary units of the relative fluorescence intensities of each sample with MetaMorph software analysis, and expressed as percentage of normoxic values. *P<0.05 versus all.

