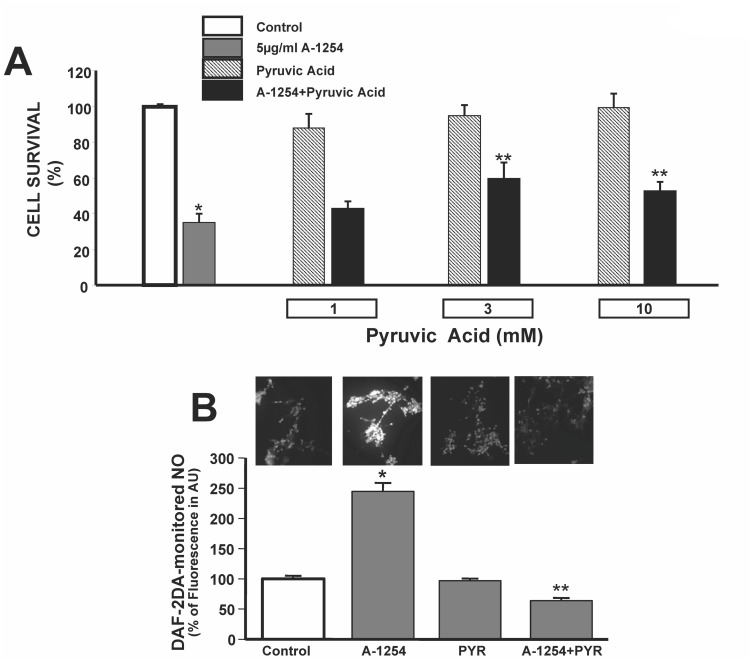
Fig 2. Effect of Pyruvic Acid on A1254-Induced Cell Injury and DAF-2DA-monitored NO in SH-SY5Y cells.
Panel A. Quantification of cell viability assessed by MTT assay in SH-SY5Y cells exposed to A1254 (5 μg/ml/24 hrs) in the presence of different concentrations of pyruvic acid (1-3-10 mM). Each bar represents the mean of 10 separate experiments. *P < 0.05 versus Control, **P < 0.05 versus A1254. Panel B. Representative fluorescent images of neuroblastoma cells stained with DAF-2DA probe in control conditions, after 6 hr exposure to A1254 (5 μg/ml), in the presence of pyruvic acid (10 mM) alone and after 6 hr exposure to A1254+ pyruvic acid (10 mM). The intensity of fluorescence was calculated as arbitrary units of the relative fluorescence intensities of each sample, and expressed as percentage of control values (considered as 100%). *P<0.05 versus control cells; **P < 0.05 versus A1254.

