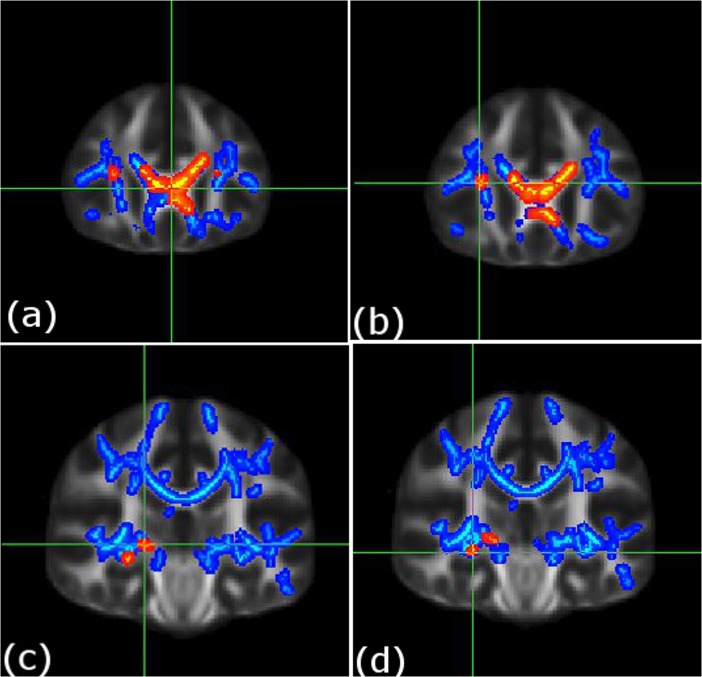
Fig 1. Decreases in white matter integrity in t(1;11) translocation carriers (n = 7) versus non-carriers (n = 13) and in patients (n = 34) versus controls (n = 33).
Deceased white matter integrity in translocation carriers versus non-carriers (shown in red), and in the patient group versus the control group (shown in blue). Individual figures (a-d) present the main cluster peak co-ordinates for the translocation carrier versus non-carrier comparison; (a) left genu of corpus callosum [–3, 28, 6], (b) right inferior fronto-occiptal fasciculus [29, 26, 15], (c) right acoustic radiation [20, 25, 0], and (d) right fornix [28, −24, −8]. For further details see Table 2. To aid visualization the results (pfwe < 0.05) are thickened using the “tbss-fill” command. Statistics for FA decreases in the patient group versus controls for these peaks; cluster 1: p = 0.023 at [-3, 28, 6; left genu of corpus callosum], cluster 2: p = 0.032 at [29, 26, 15; right fronto-occipital fasciculus], cluster 3: p = 0.012 at [11, 26, 14; right genu of corpus callosum], cluster 4: p = 0.033 at [20, 25, 0; right acoustic radiation], and cluster 5: p = 0.031 at [28, -24, -8; right fornix] i.e. for clusters 1–5 respectively, see, Table 2).

