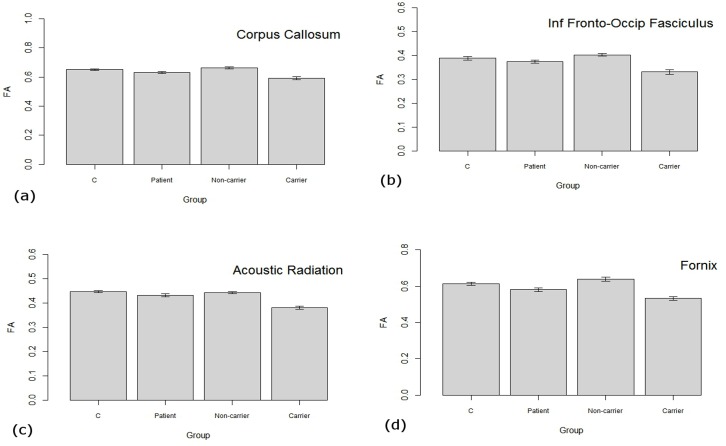
Fig 2. FA values extracted from clusters of differences between carrier and non-carrier groups.
Individual figures represent FA values across the main clusters of differences from the comparison of translocation carrier versus non-carrier comparison; (a) cluster 1: genu of corpus callosum, (b) cluster 2: right inferior fronto-occiptal fasciculus, (c) right acoustic radiation, and (d) cluster 4: right fornix. C = control group, Patient = group with mixed psychoses, Non-carrier = family members not carrying translocation, Carrier = family members with the translocation.

