Figure 1.

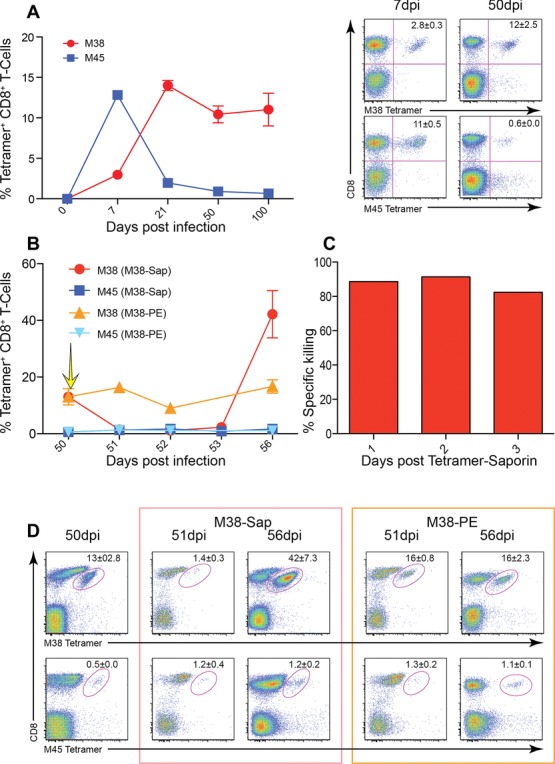
Frequency and function of MCMV-specific CD8+ T cells and depletion of M38-specific CD8+ T cells. C57BL/6 mice were infected intravenously (i.v.) with 1 × 10⁶ pfu MCMV. (A) Time course for M38- (red) and M45- (blue) specific CD8+ T cells. Lymphocytes from 0, 7, 21, 50, and 100 days postinfection mice were stained with tetramers, and analyzed by flow cytometry. Right panel: representative flow cytometry plots showing tetramer+ CD8+ T lymphocytes are shown (n = 8/group). (B) Fifty days postinfection, mice were injected with either M38-teramer-saporin or M38-tetramer-PE. Yellow arrow indicates time point of M38-Saporin injection. Time course for M38- (red) and M45- (blue) specific CD8+ T cells after injection with M38-teramer-saporin, and M38- (orange) and M45- (light blue) specific CD8+ T cells after injection with M38-tetramer-PE. Mice were bled 0, 1, 2, 3, and 6 days postinjection, stained with tetramers, and analyzed by flow cytometry. (A and B) Data represent mean percentages of live tetramer+ CD8+ T lymphocytes (mean ± SEM) of (A) n = 8 or (B) n = 6/group and are pooled from two independent experiments. (C) The percentage killing of M38-specific CD8+ T cells after injection with M38-teramer-saporin analyzed by flow cytometry. Data represent mean percentages of specific killing of tetramer+ CD8+ T lymphocytes (n = 6/group) and are pooled from two independent experiments. (D) Representative flow cytometry plots of M38-specific CD8+ T cells and M45-specific CD8+ T cells 50 days after MCMV infection, 1 and 6 days after either M38-tetramer-saporin (red box) or M38-tetramer-PE injection (orange box). Data are shown as mean ± SEM and are from one representative plot out of 6/group).
