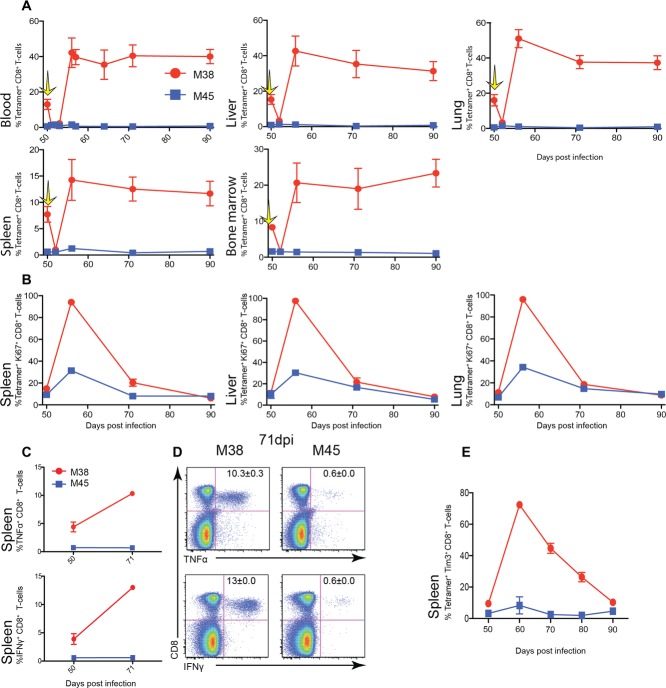
Figure 2.
Increased frequency of M38-specific CD8+ T cells after depletion. C57BL/6 mice were infected (i.v) with 1 × 10⁶ pfu MCMV. Fifty days postinfection, mice were injected with M38-teramer-saporin, lymphocytes harvested from the blood, liver, lung, spleen, and bone marrow at 0, 2, 6, 21, and 40 days postinjection stained with tetramers, and analyzed by flow cytometry. (A) Time course showing mean percentages of live tetramer+ CD8+ T lymphocytes isolated from the blood, liver, lung, spleen, and bone marrow. Yellow arrow indicates time point of M38-Saporin injection. (B) Time course displaying the percentage of cells expressing Ki67 on M38- CD8+ T cells (red) and M45-specific CD8+ T cells (blue) in the spleen, liver and lung at indicated time points postinjection with M38-tetramer-saporin. (C) Change in the percentage of cells expressing IFN-γ, and TNF-α before and 21 days after M38-tetramer-saporin injection. Splenocytes were harvested and stimulated with either M38 or M45 peptide. (D) Representative flow cytometry plots of splenocytes producing IFN-γ and TNF-α stimulated with either M38 or M45 peptide in mice 21 days after M38-tetramer-saporin injection. Numbers indicate the percentage of IFN-γ+ CD8+ T cells (mean ± SEM). Plots are representative of two independent experiments. (E) Time course showing the percentage of cells expressing Tim3 on M38-specific CD8+ T cells (red) and M45-specific CD8+ T cells (blue) in the spleen, liver, and lung at indicated time points postinjection with M38-tetramer-saporin. (A–E) Data are shown as mean ± SEM (n = 6) and pooled from two independent experiments.

