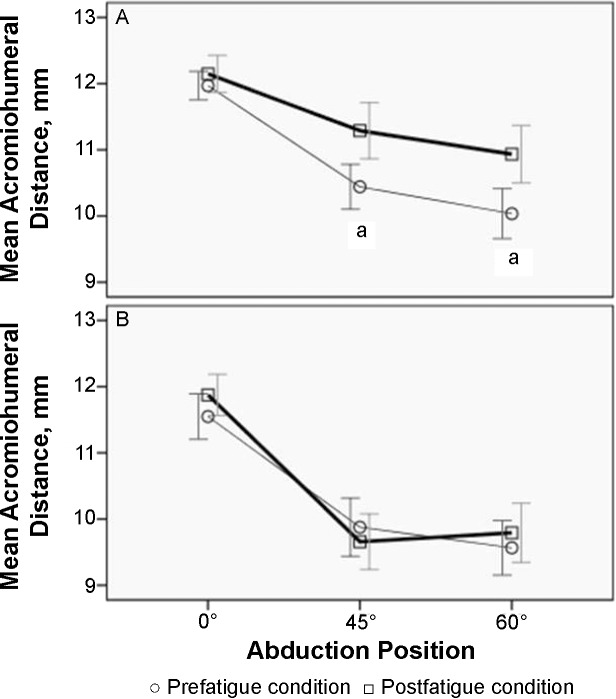
Figure 4.
Sonographic acromiohumeral distance measurements on the, A, dominant and, B, nondominant sides and before and after fatiguing the dominant side. The x axis displays the position of abduction at which the measurement was taken. The y axis displays the acromiohumeral distance in millimeters. Error bars indicate 95% confidence intervals. a Indicates the difference between prefatigue and postfatigue conditions.

