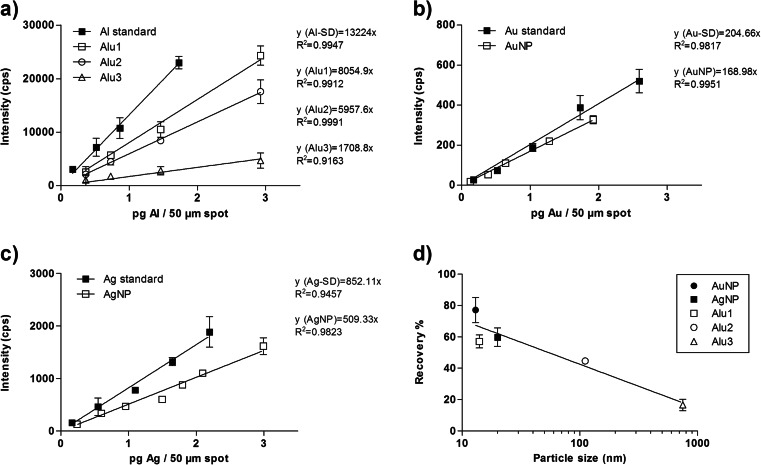
Fig. 2.
Signal intensity recorded by LA-ICP-MS for different ENPs and for metal cations (element standards) from agarose gels versus concentration of (a) Al2O3, (b) Au, and (c) Ag (n ≥ 3). Signal intensity for ENP relative to the respective metal cation (recovery) versus the ENP size is shown in (d)

