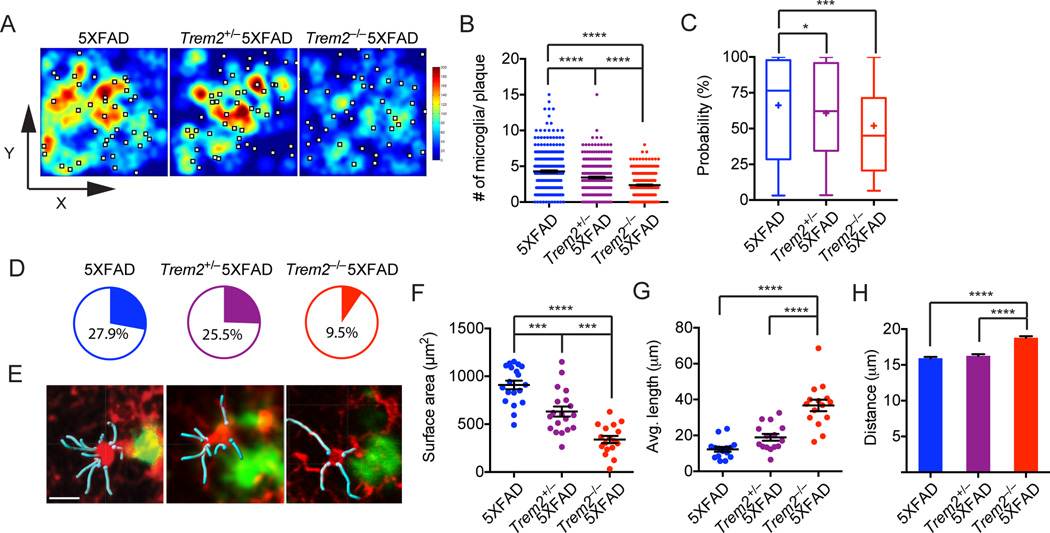
Figure 4. TREM2 deficiency diminishes the capacity of microglia to cluster around amyloid plaques.
Frequencies of plaque-associated microglia in 8.5 month-old Trem2−/−5XFAD, Trem2+/−5XFAD and 5XFAD mice were determined. (A) Heatmap shows frequencies of microglia in relation to amyloid plaques shown as white squares. (B) Summary of frequencies of plaque-associated microglia in all analyzed genotypes. (C, D) Microglia clustering around plaques in 5XFAD, Trem2+/−5XFAD and Trem2−/−5XFAD mice were compared to Monte Carlo simulations that assume total randomness between plaques and microglia. Probabilities that any given microglia-plaque cluster are non-random are shown in (C). Pie charts show frequencies of microglia-plaque clusters that cannot be statistically explained as random (p<0.05) (D). (E) Morphology of plaque-associated microglia highlighting the shape of cell bodies (red) and primary processes (cyan). (F–H) Plaque-associated microglia are analyzed for their surface area (cell body only), average length of primary processes and distance from the center of adjacent amyloid plaque. Original magnification: 20×; scale bar= 15µm. *p<0.05, ***p<0.001, ****p<0.0001, one-way ANOVA. Data represent analyses of a total 7 mice per group (A–D) and a total of 5 mice per group (E–G). Bars represent mean±SEM. See also Figure S4.

