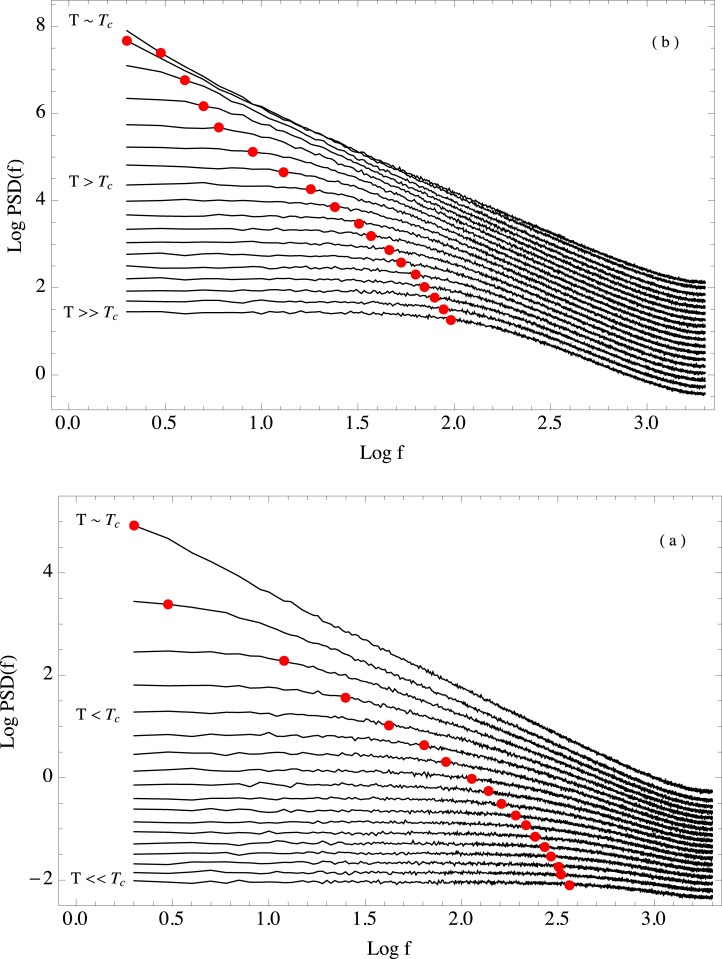
Fig 8. Power Spectral Density as a function of temperature.
Ensemble behavior of the Power Spectral Density as a function of temperature. Panel (a) shows the behavior of the PSD for temperatures T ≤ T c. Temperature increases from bottom to top, with T c corresponding to the topmost curve. Panel (b) shows the behavior of the PSD for temperatures T ≥ T c. Temperature increases from top to bottom, with T c corresponding to the topmost curve. The crossover frequency for each temperature is shown as a red dot.

