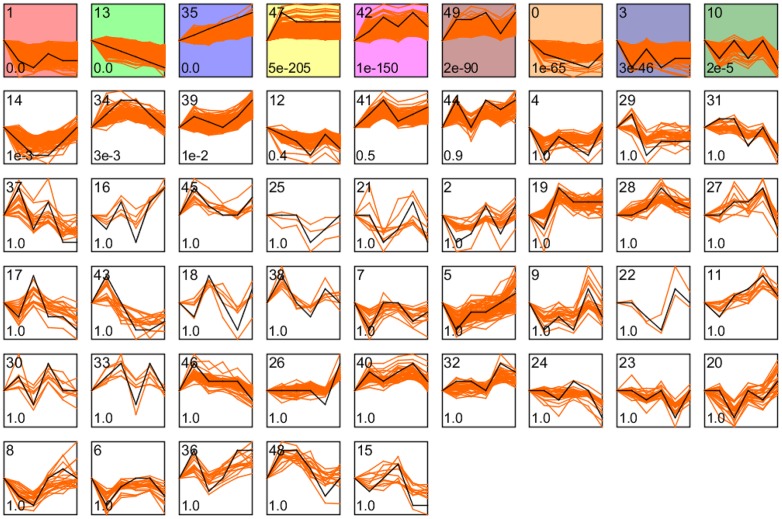
Fig 10. Short Time-series Expression Miner (STEM) clusters of expression profiles with HSR genes in Chiifu.
The number of profiles in each cluster is at the top left corner of each STEM. Profiles are ordered based on the p-value significance of the number (at bottom-left corner) of assigned versus expected genes. Colored frame denotes significant profiles (P-value≤0.01). Each graph displays the mean expression pattern (black lines) of the profile genes.

