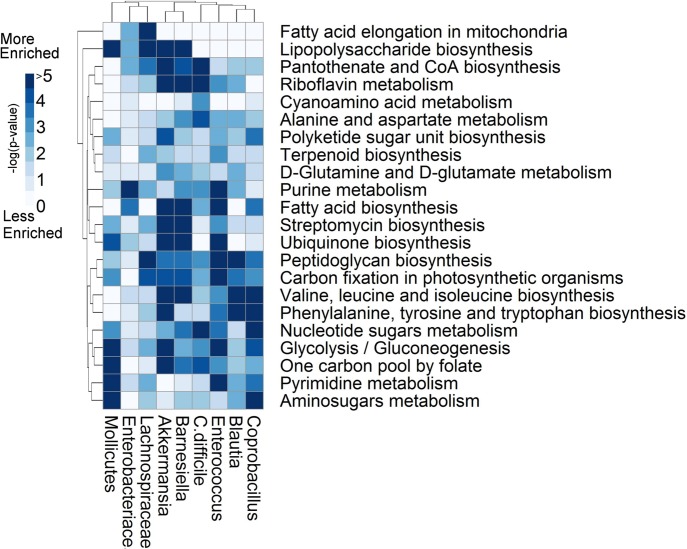
Fig 4. Subsystem enrichment analysis highlights metabolic differences between taxa.
The p-values from the enrichment analysis are log-transformed and negated, such that darker regions indicate greater enrichment. The enrichment analysis quantifies the likelihood that a given subsystem (row) would be as highly abundant as observed within a given metabolic reconstruction (column) by chance alone. A subset of 22 interesting subsystems is shown here. Subsystems of interest include those for which all taxa are enriched, such as glycolysis, and nucleotide sugars metabolism, highlighting the fact that all taxa contain relatively full compliments of reactions within those subsystems. Similarly, subsystems for which a single genus differs from the remaining genera are interesting, such as cyanoamino acid metabolism, where C. difficile is highly enriched for reactions in that subsystem. Some subsystems are differentially enriched between Barnesiella and Lachnospiraceae, and C. difficile such as lipopolysaccharide biosynthesis and cyanoamino acid metabolism.

