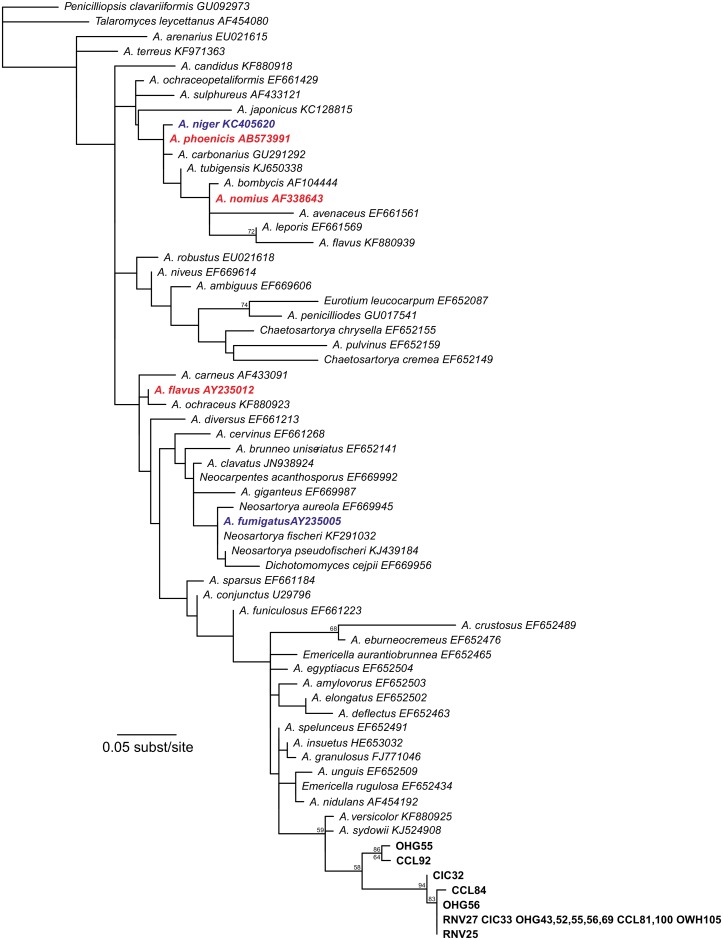
Fig 3. Maximum-likelihood estimate of Aspergillus species based on 28S DNA sequence data.
Numbers above nodes represent bootstrap proportions; numbers below nodes represent posterior probabilities. Values below 50% have been removed to enhance readability and interpretation. Sequences from this study are indicated by sample location code and nest number. Colors indicate pathogenicity as tested in honey bees [32]; red: pathogenic, blue: apathogenic, black: not tested.

