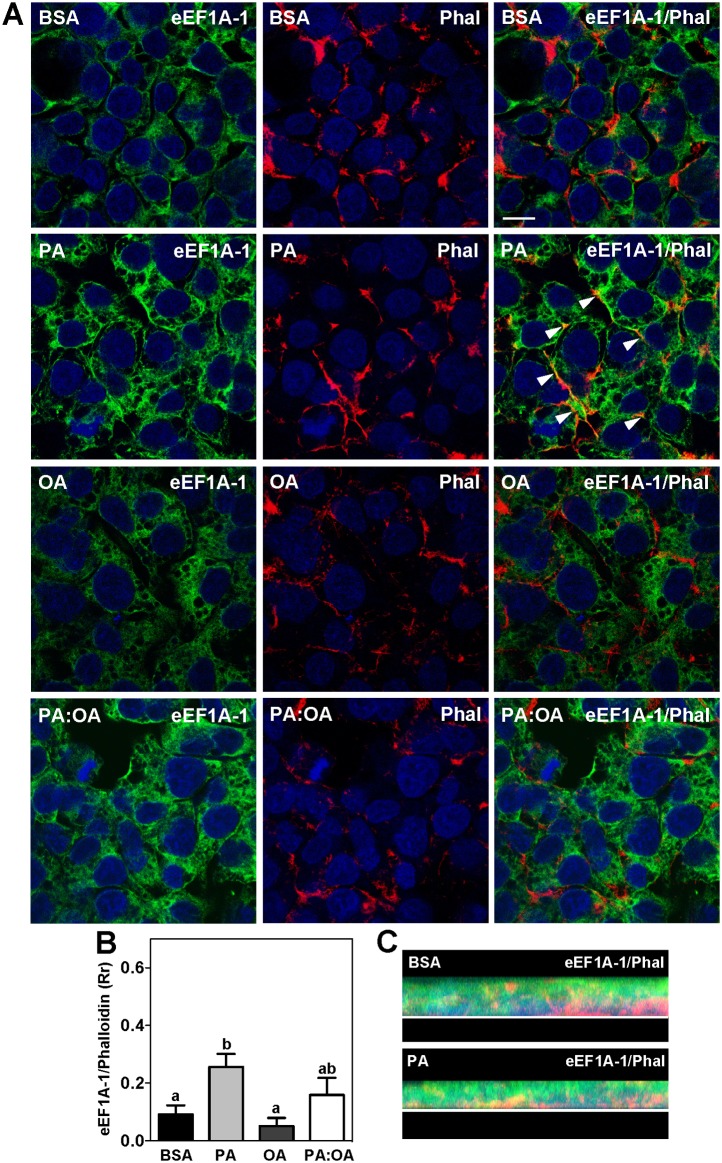
Fig 4. eEF1A-1 Co-localization with the Actin Cytoskeleton is Increased During Exposure to Excess Palmitate.
(A) HepG2 cells were incubated for 6 h with growth media containing BSA alone, or fatty acids as described in Fig 1, at a total concentration of 1.0 mM. eEF1A-1 and polymerized actin localization were assessed by confocal fluorescence microscopy of fixed cells. eEF1A-1 was visualized (green) as in Fig 2. F-actin was visualized using rhodamine phalloidin (Phal) (red). Nuclei were counterstained with DAPI (blue). Yellow indicates regions of co-localization between eEF1A-1 and F-actin (white arrowheads). Scale bar represents 10 μm. Representative images from 4 independent experiments are shown. (B) Co-localized signal for eEF1A-1 and F-actin in A (yellow) was quantified using Pearson’s correlation coefficient (Rr) to assess overlap between eEFIA-1 (green) and phalloidin (red). Data are means ± SEM for n = 4. Different lower case letters are statistically significant at p<0.05. (C) Images constructed from a z-series of optical sections of cells from A treated with BSA and PA, respectively. The white line represents the surface to which cells were adhered.

