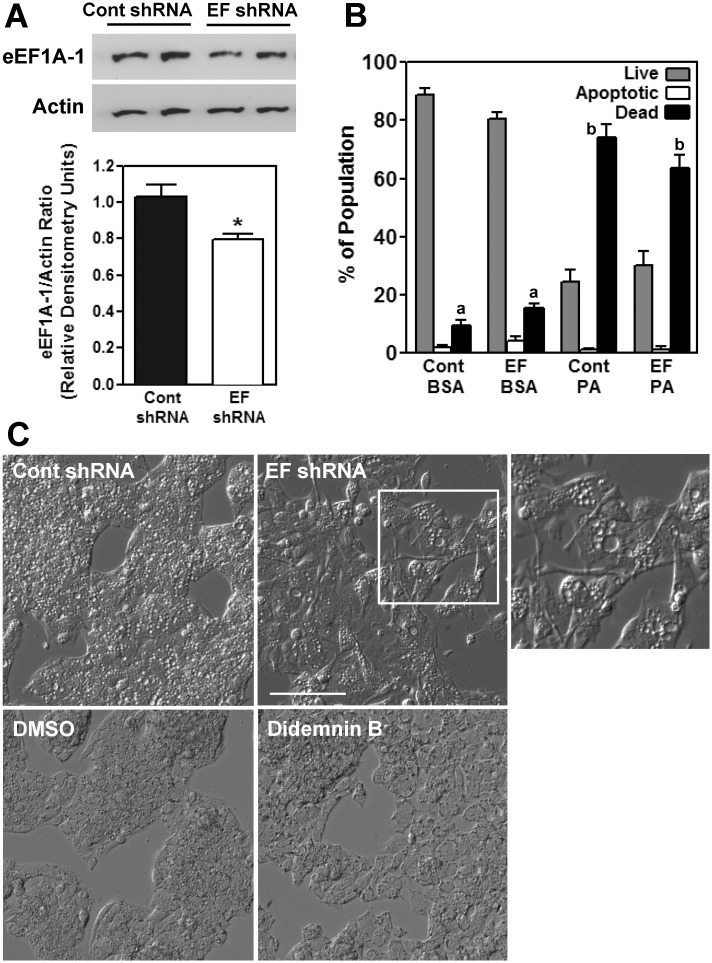
Fig 6. Modest Long-term Inhibition of eEF1A-1 Expression Alters HepG2 Cell Morphology.
(A) Stable HepG2 cell populations were generated expressing either control shRNA against no known target (Cont shRNA), or shRNA targeted against EEF1A1 (EF shRNA). eEF1A-1 and actin protein levels from whole cell lysates were detected by immunoblotting. Representative blots are shown. Bands were quantified by densitometry and normalized to actin. Data are means ± SEM for n = 4 experiments, * p < 0.05. (B) Control shRNA and EF shRNA expressing cells were incubated for 48 h with growth media containing either BSA or 1.0 mM palmitate (PA). Cells were harvested and stained with PI and Ann V. Percentages of apoptotic and dead cells were determined by flow cytometry. Data are means ± SEM for n = 3. (C) Light microscopy of live cells showing morphology of control shRNA or EF shRNA expressing cells and wild type HepG2 cells treated with either DMSO or didemnin B (80 nM) for 48 h. The white outline indicates the enlarged area. Scale bar represents 100 μm.

