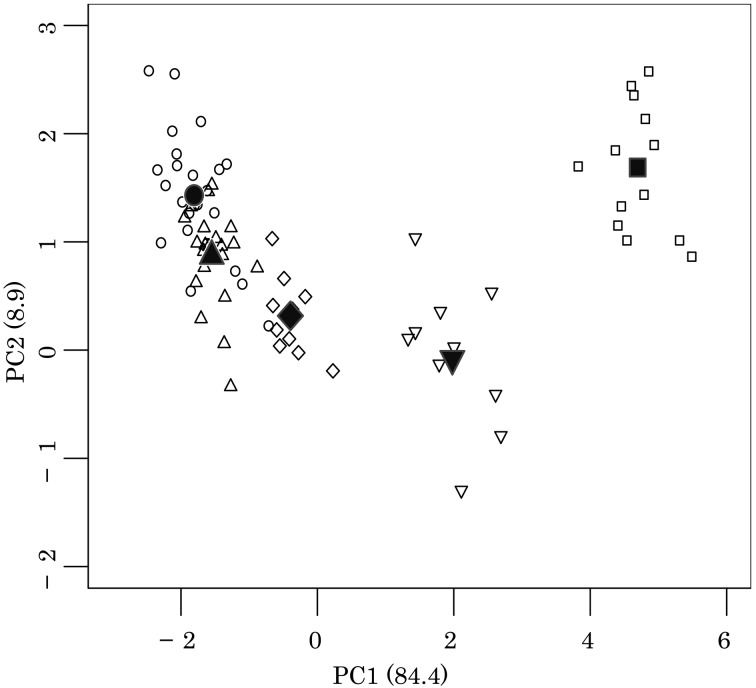
Fig. 3.
Plot of PC1 and PC2 scores of bone measurements for the five mustelid species. PC1;
the first principal component. PC2; the second principal component. Numbers in
parentheses represent the percentage of the variation explained by the component.
 , Enhydra
lutris.
  , Lutra
lutra.
  ,
Neovison vison.
  , Mustela itatsi.
  , Mustela sibirica. Filled symbols indicate mean values of each
species.

