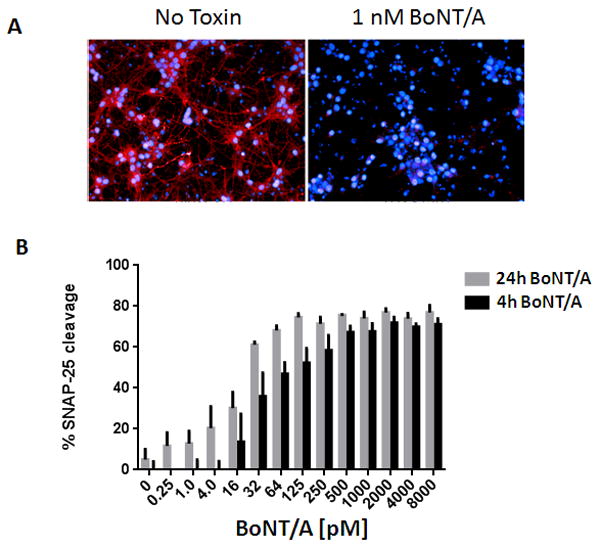
Figure 4. HCI of SNAP-25 cleavage in mouse ES-derived neuron cultures.

Motor neuron cultures were treated with increasing concentrations of BoNT/A for 4 and 24 hours to evaluateSNAP-25 cleavage efficacy. SNAP-25 was detected with BACS antibodies. In another channel (not shown), neurons were detected with βIII-tubulin antibody to create masks of neurons for SNAP-25 image analysis. (A) Representative image of one field (from 7 taken) for wells either untreated (no toxin, left) or treated with 1nM BoNT/A for 24h (right). Blue indicates nuclei stained with Hoechst 3339 and red is the BACS signal. (B) The data was analyzed using the Columbus (PerkinElmer) algorithm and the values for the signal associated with the cleavage sensitive BACS was normalized to the total βIII-tubulin signal. Error bars represent standard deviation. The percent cleavage of SNAP-25 was plotted using GraphPad Prism (n=3 for each point).
