
Figure 4.
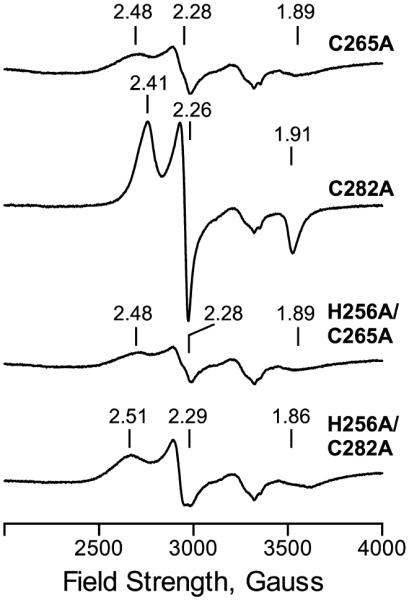
EPR spectra of Fe3+-HO2tailR variants. Samples were prepared and run as described (see Methods). The g values are indicated above the spectra of Fe3+-HO2tail(C265A)R, Fe3+-HO2tail(C282A)R, Fe3+-HO2tail(H256A/C265A)R, and Fe3+-HO2tail(H256A/C282A)R.