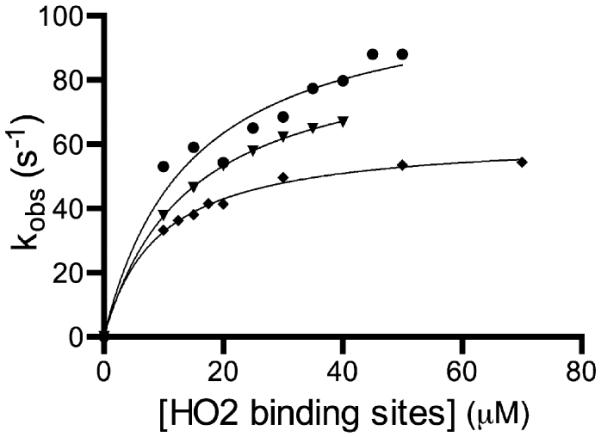
Figure 7.

Plot of observed rate constants as a function of the concentration of available Fe3+-heme binding sites on HO2. The apo form of HO2core (▼), HO2tail(C282A)R (●), or HO2solR (◆) was mixed at various concentrations with Fe3+-heme in a stopped-flow instrument within an anaerobic chamber. Data were collected at 20 °C while monitoring was conducted at 406 nm. The data were fit to eq 1 as described in the text, and the resulting fits are represented as solid lines.
