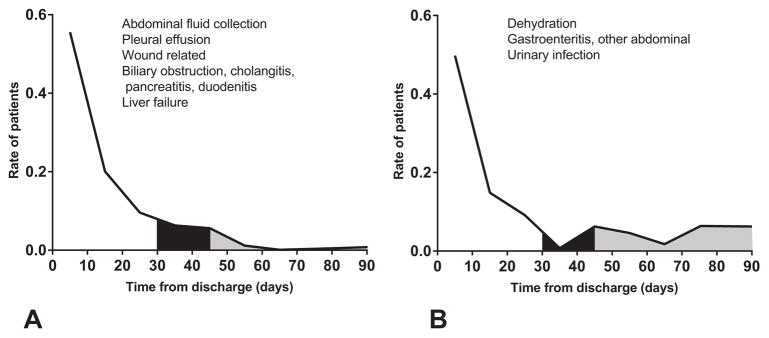
Figure 4.

(A, B) Readmission indications classified according to pattern of presentation after discharge. The readmission rate was calculated for each indication and assessed with the time point of the readmission. The black area under curve represents patients included by extending the time interval of readmission from 30 days to 45 days, and the grey area under curve represents patients included by extending the time interval of readmission from 45 days to 90 days.
