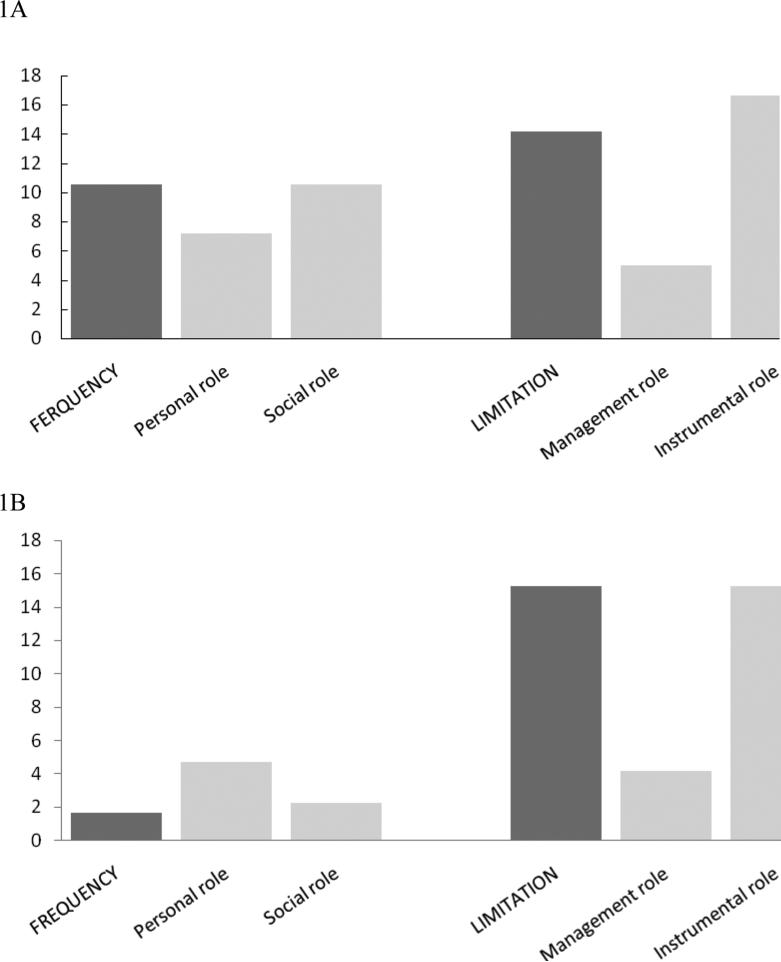
Figure 1.
Comparison of percentages of participants demonstrating a decline (1A) or improvement (1B) ≥ the minimal detectable change (MDC90) over 2 years of follow-up on the Late-Life Function and Disability Instrument frequency and limitation dimensions and their subscales. For example, as shown in Figure 1B, 2% of participants improved ≥ the MDC90 of 7.4 points for the frequency dimension, compared to 15% of participants that improved ≥ the MDC90 of 11.6 points for the limitation dimension.

