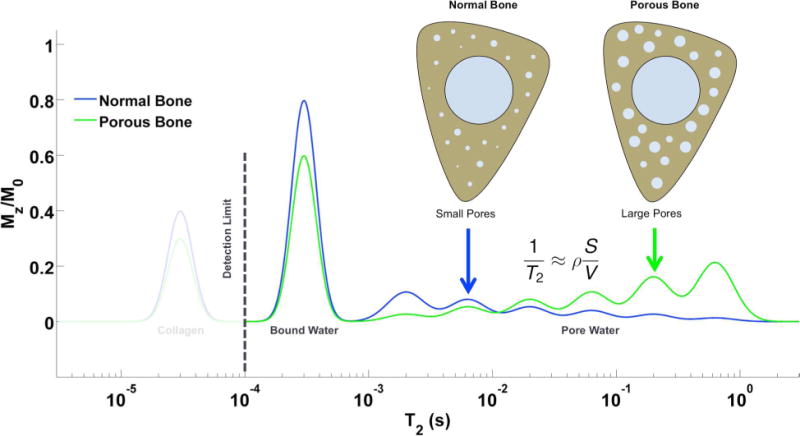
Figure 1.

Cartoon T2 relaxation spectrum diagramming the three major 1H NMR signal pools in bone. Pore water has T2 > 1 ms, while bound water has T2 ~ 300–500 μs. Collagen signal, at T2 ~ 40–60 μs, is below the detection limit at clinical field strengths, but becomes visible using micro-imaging and spectroscopic hardware. As porosity increases, collagen and bound water decrease, while pore water increases and shifts to longer T2 values due the smaller surface-to-volume ratio of enlarged pores. This figure is adapted from Li et al. (16).
