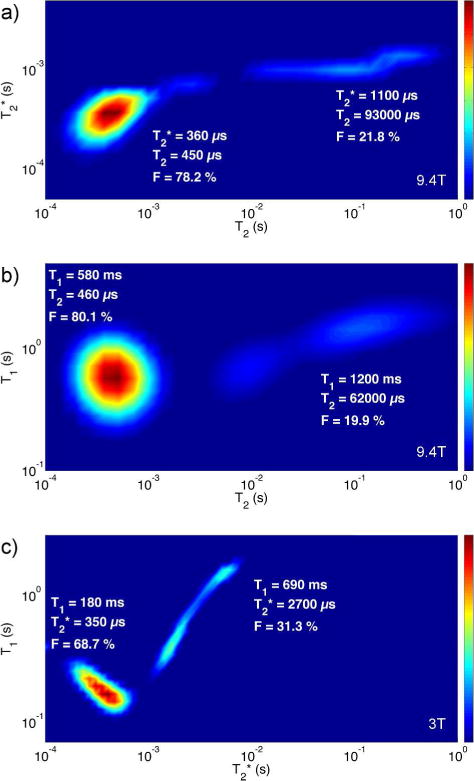
Figure 5.

2D T2*–T2 and T1–T2 1H relaxation spectra at 9.4T, and 2D T1–T2* relaxation spectrum at 3T, generated using the MERA software package (43). Spectra are from a bone specimen taken from a 37 year old male donor. The T2*–T2 spectrum is generated from CPMG data, the T1–T2 spectrum from SR-CPMG data, and the T1–T2* spectrum from SR-FID data.
