
Figure 8.
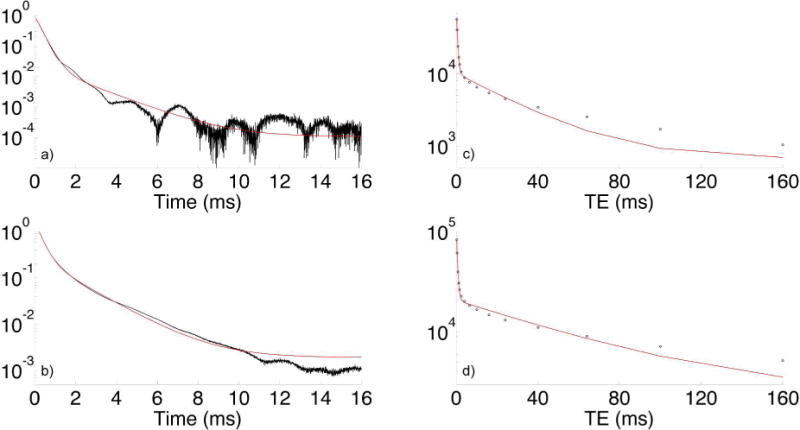
Log-magnitude FID at 7T of a cortical bone specimen from a 53 y/o female donor (a). Note the irregular oscillation of the signal, which causes failure of bi-exponential fitting (green line, R2 = 0.999592): 97.4% short- T2* signal fraction, versus 86.6% by 2D T1–T2 bi-exponential fitting at 9.4T. Fat at 7T is 1040 Hz off-resonance. A FID from a 53 y/o male donor (b) not exhibiting these oscillations is also shown for comparison (R2 = 0.999901). Similar plots of fitted CPMG echo amplitudes for the same 53 y/o female (c) and male (d) donors are also shown.