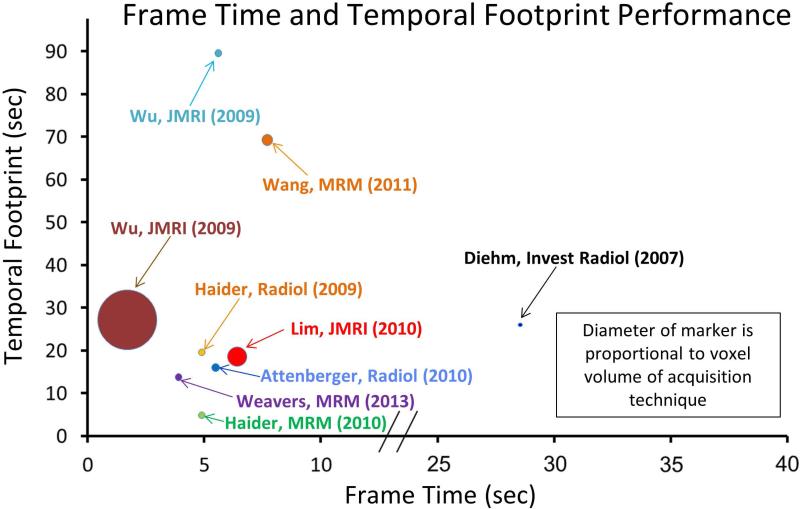
Figure 12.
Plot of temporal footprint vs. frame time for time-resolved 3D CE-MRA techniques for imaging the calves listed in Table 2. Diameter of marker for each technique is proportional to the voxel volume of the acquisition. Smaller marker size reflects improved spatial resolution.

