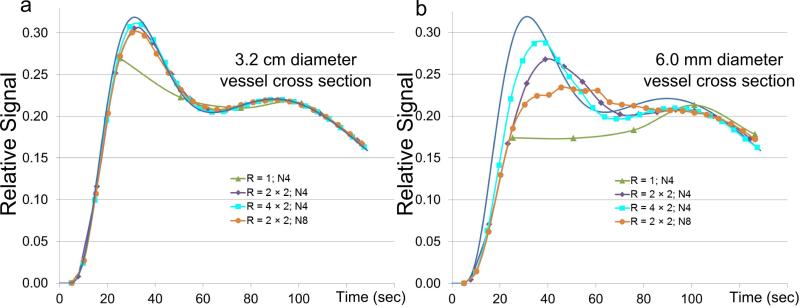
Figure 8.
Illustration of temporal fidelity vs. various acquisition strategies for two different assumed vessel diameters for assumed Y × Z FOV of 320 × 132 mm2. In both (a) and (b) the reference curve, representing actual arterial signal enhancement, is shown in blue. (a) Assumed diameter of vessel in the axial (Y-Z) plane is 32 mm. Other than the unaccelerated acquisition (green), all strategies provide a good match of the reconstructed signal with true assumed reference signal. (b) Assumed vessel diameter of 6 mm. As acceleration increases from R = 1 to 4 to 8 the match of the reconstructed signal with the reference improves and the frame time also decreases. For fixed acceleration R = 4, as additional view sharing is included, going from N4 (purple) to N8 (orange), although the frame time is reduced, the fidelity decreases owing to the increased temporal footprint

