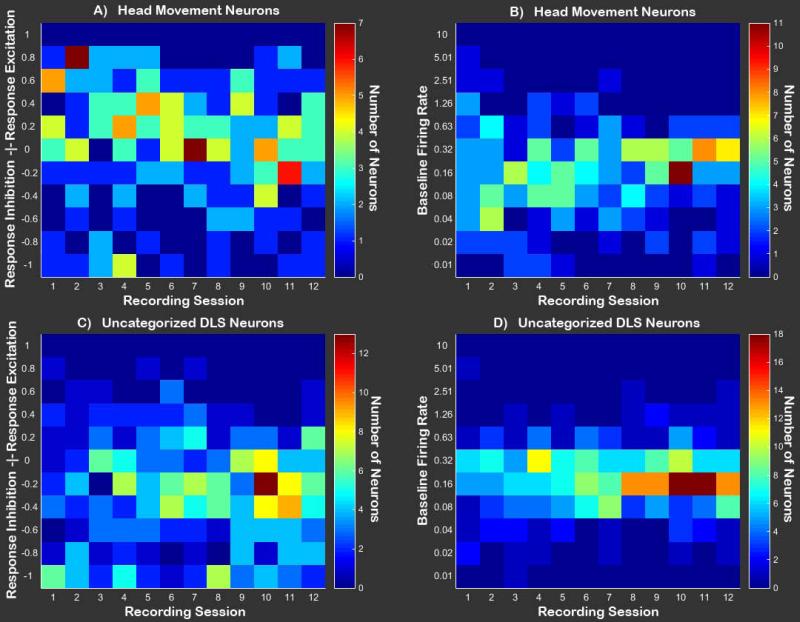
Figure 5. Population level visualization of DLS neuron activity.
A Heat map containing the number of DLS Head Movement neurons falling into each category of response modulation during the operant [(Response FR-Baseline FR)/(Response FR+Baseline FR)] across sessions. Values greater than zero represent response excitation, while values below zero represent response inhibition. B Heat map containing baseline firing rates for all DLS Head Movement neurons across sessions. C Heat map containing the number of DLS Uncategorized neurons falling into each category of response modulation during the operant. D Baseline firing rates for all DLS Uncategorized neurons across sessions.

