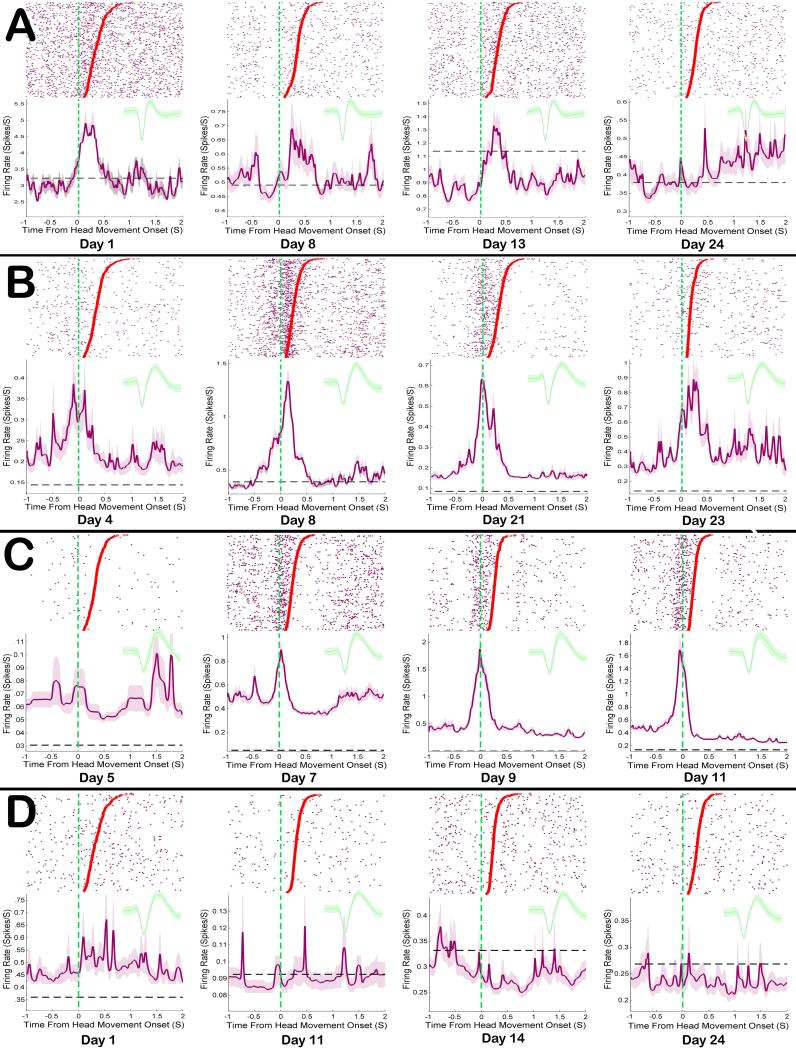
Figure 8. Examples of DLS response related firing patterns tracked across sessions.
Each row A-D shows rasters and peri-response histograms for a single neuron across sessions, as well as the mean waveform recorded during each session. Each row of the raster shows action potentials (purple dots) during a single movement. The onset of each movement is aligned to time zero, movement durations are sorted in descending order, and the offset of each individual movement is displayed as a dot. Shaded lines in each histogram show response related FR, while the dashed black lines show baseline FRs. A Some Head Movement neurons were highly excited by responses early in training and lost that activity across sessions. B Some remained stable throughout training, while still other C Head Movement neurons’ response excitation became progressively more robust across sessions. D Uncategorized neurons in this study showed primarily mild inhibitions during the head movement response.

