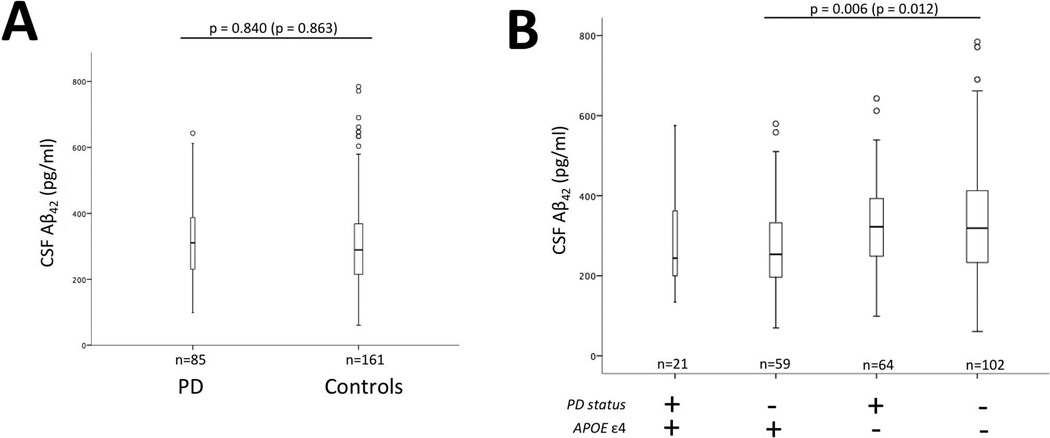
Figure 1.
Cerebrospinal fluid (CSF) levels stratified by disease status and APOE status. There is not a significant difference in CSF Aβ42 levels between Parkinson’s disease (PD) and cognitively normal control subjects (Controls) (Panel A). There is a significant difference in CSF Aβ42 levels in controls between APOE ε4+ and APOE ε4− but not PD (P-values are Bonferroni corrected for multiple comparisons: Panel B). Bars represent interquartile range for CSF Aβ42 levels. P-values are adjusted for covariates gender and age. P-values in parentheses are not adjusted for covariates and bar graphs are not adjusted for covariates. The horizontal line within the quartiles represents the median. The vertical lines represent minimum and maximum CSF Aβ42 levels. Circles represent outliers.

