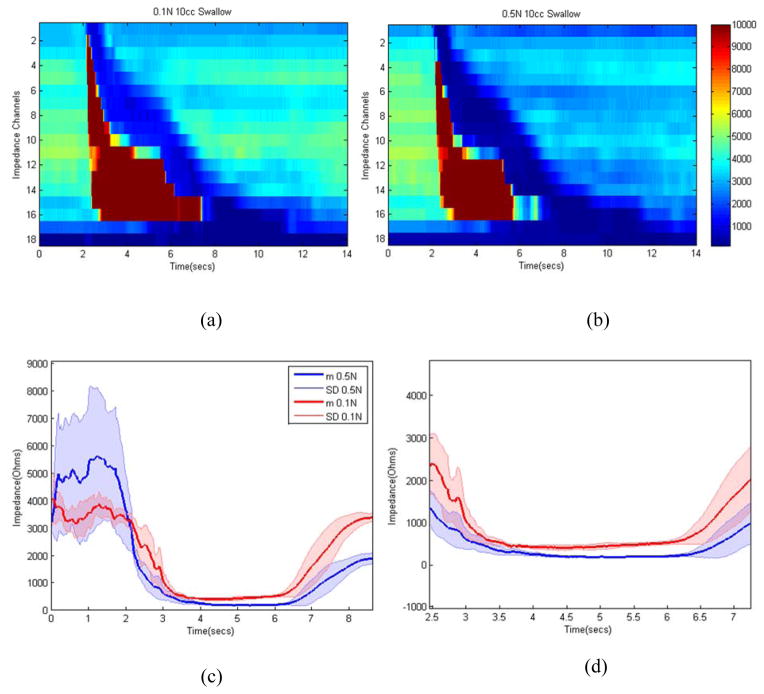
Figure 4.
(a) Impedance topographs of sample 10cc swallow: (a) 0.1N, (b) 0.5N, (c) Impedance tracing with swallows of 0.1N and 0.5N saline swallows, lines represent mean value and the shaded area around them represents one standard deviation, (d) zoomed version of (c) between 2.5 and 7.5 seconds. Note, following the swallow there is increase in the impedance value, which represents passage of air over the electrode followed by drop in impedance which reflects passage of saline bolus over the electrodes. Nadir impedance values are lower with 0.5N compared to 0.1N saline.

